

Performance Recommendations for Advanced Dashboards and Reports
This article describes the following best practices for optimizing the performance of Advanced Dashboards and Reports:
Delete unnecessary tabs and visuals
When you save a copy of the default dashboards or reports, you’re saving every tab and every visual provided. The default dashboards and reports are more of a catalog of what’s available and what might be useful, rather than a recommendation for what to use.
While multiple charts and tables can load data at once, and data is only loaded as the visual appears on the screen, the data you don’t want can get in the way of the data you do want.
For faster loading, try the following in Explore mode.
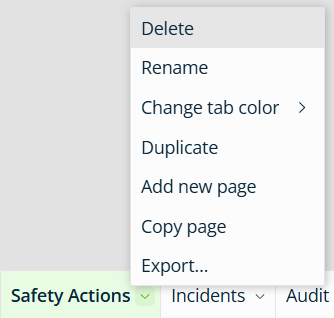
- To delete a tab, right-click the tab, and select Delete.
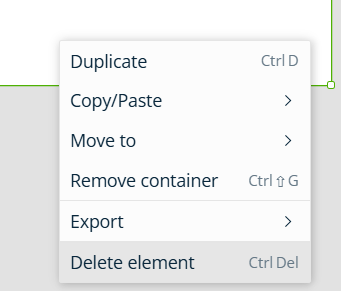
- To delete a chart or table, right-click the visual and select Delete element.
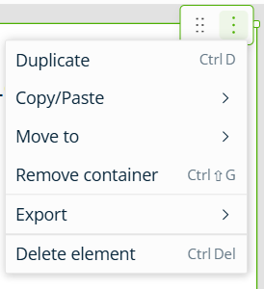
Or, use the actions menu at the top-right to delete visuals.
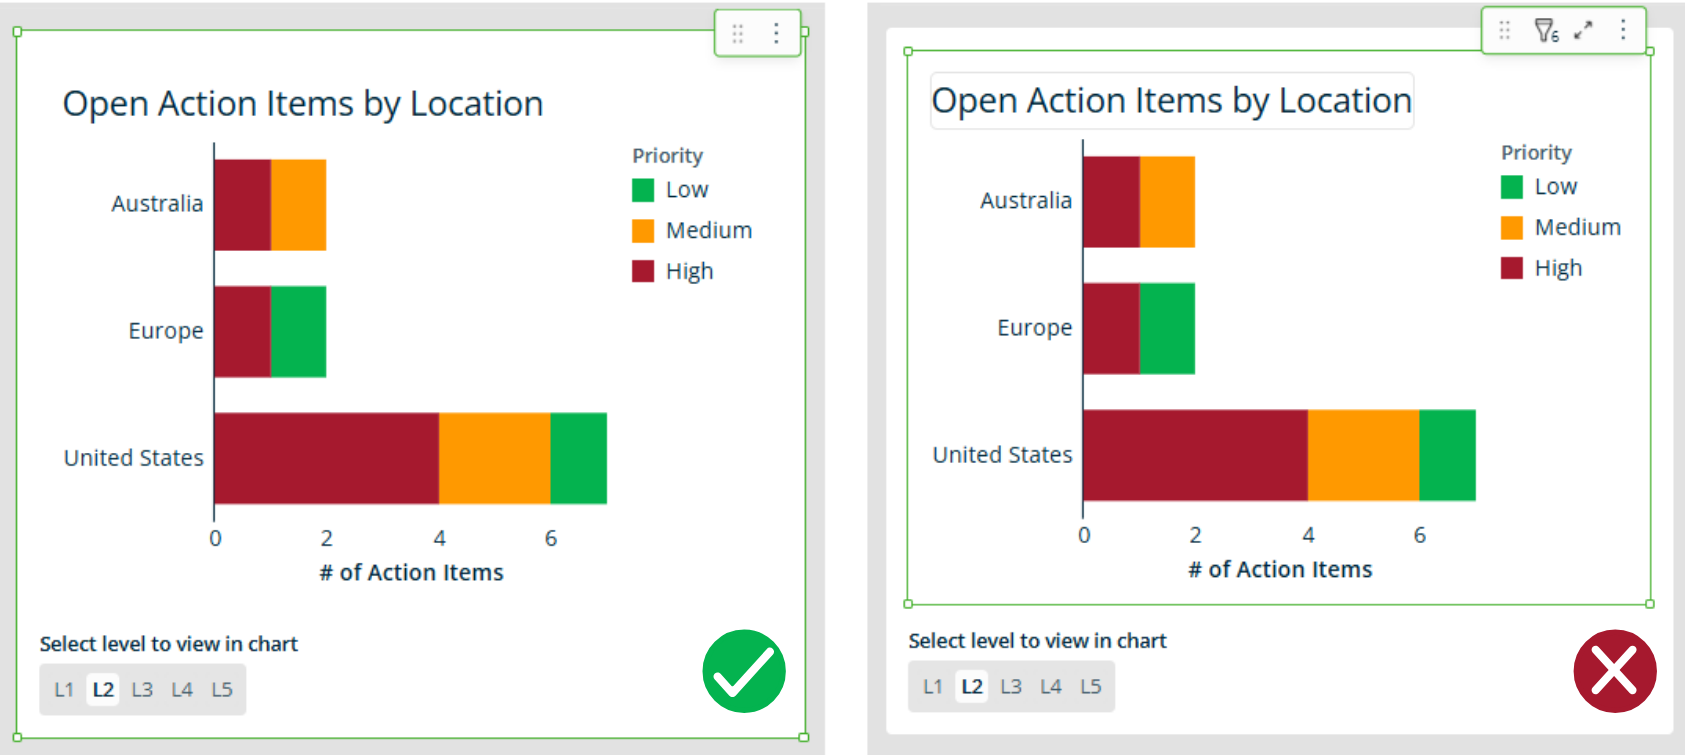
- Many of our visuals are housed in containers, which are objects that keep the visual and filter/display controls together. When deleting a visual, delete the entire container rather than only the visual:
- To delete a tab, right-click the tab, and select Delete.
Use tabs to separate information
Place only one or a few visuals on a tab (one screen’s worth, for example) to reduce load times. This will ensure that only necessary data is loaded as it becomes needed.
Include as few columns as possible
Each column contains an extra data point for every row in your table (which could be in the tens or hundreds of thousands). The default dashboards and reports provide columns that are often useful, but not all columns are needed in every scenario.
For example, consider the Open Action Items by Source chart: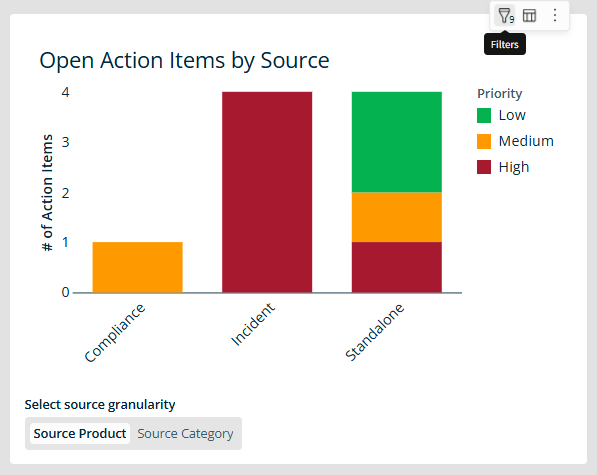
This chart requires a maximum of 13 columns:
- 9 columns to support the 9 filters
- 1 column to support the Priority
- 2 columns to support the Source Product and Source Category
- 1 column to support the # of Action Items
However, the Priority and Source Category are included in the filters, so the total number of columns for this chart is 11.
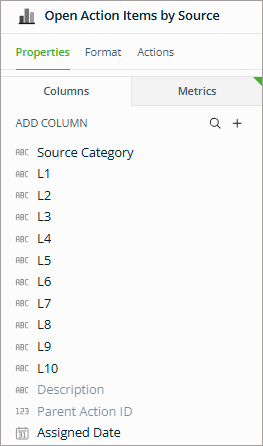
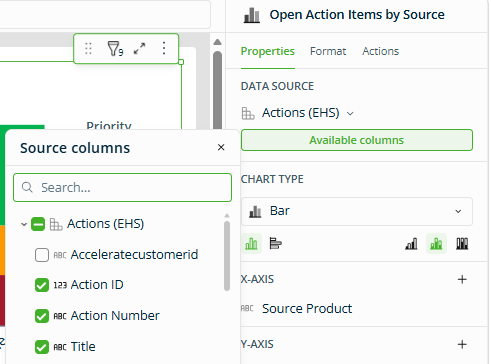
The visual on the Default Dashboard has many more columns; some of those columns may be useful, so it’s more convenient to show them. Note that the columns in gray, Description and Parent Action ID, are hidden but still included. Hiding a column means it won’t appear when expanding a visual to see the data in table format, but the hidden column is still usable as a filter, so it’s still loaded.
Collapse groupings on tables when possible
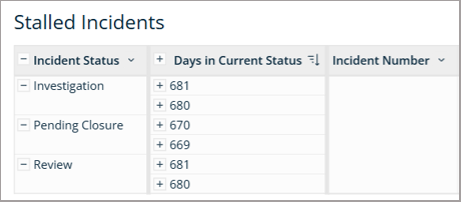
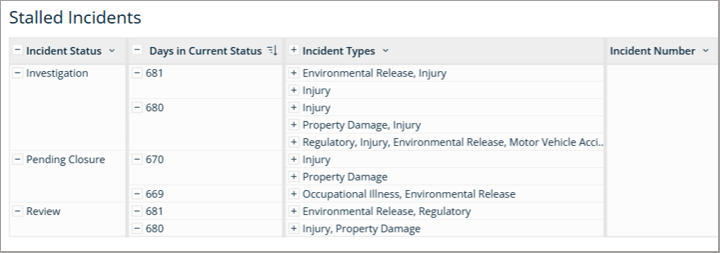
Tables can be grouped, to multiple levels, to highlight relevant data. For example, the Stalled Incidents report is grouped by Incident Status and by Days in Current Status. It shows, for each incident status, the number of days that an incident has been in the current status, as well as additional details of the incidents.
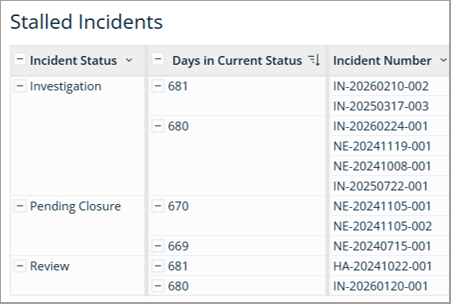
To collapse a grouping column and show only the groups, click the collapse (–) button beside a column. Because the detail rows do not need to display, the entire table loads more quickly.
If you want to load additional data points, like the Person Responsible or Incident Types, you can delete the rest of the columns or add a column as a grouping below the existing groupings. The smaller number of visible columns will display more quickly than the full table.
Hide the Summary bar for tables when not needed
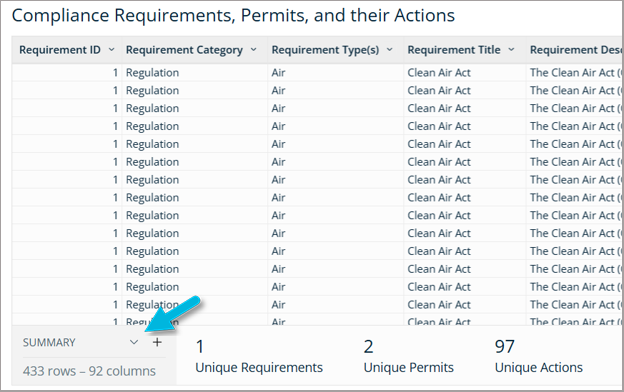
Table summaries can be a useful way to see information at a glance, but each summary is like a small additional report when it comes to loading time.
If you are using the Summary bar on a table that takes a long time to display, consider collapsing it (click the arrow/carat symbol). The numbers in the summary can be added as separate visuals (chart type KPI) if important, and extracting the visuals may mean that you can reduce the columns in the table, by grouping or deleting the unnecessary ones.
Avoid multiple open sessions
Do not leave other application tabs open when switching users or roles. Tabs signed in as another user, including timed-out or inactive sessions, may cause authentication issues when permissions differ.
Before switching, close all other application tabs. If an issue occurs, log out completely and then log back in.
