

Navigating Advanced Reports
Advanced Reports in Accelerate help you explore detailed safety and compliance data using interactive table views. Whether you’re checking on open actions, stalled audits, or incident records, this guide walks you through how to view, filter, sort, and interact with reports — no editing required.
This article is for general users with view-only access. If you’re creating or customizing reports, check out Building and Editing Advanced Reports.
Opening a Report
- Go to Platform > Advanced Reports.
- Your default report will open automatically.
- To view a different report, select the folder icon in the bottom-left corner and choose a new one.
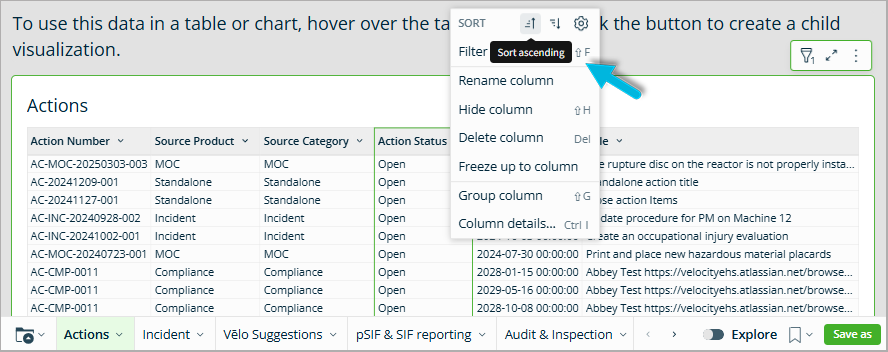
Sorting Columns
You can apply sorts to multiple columns to organize your data more precisely.
To sort column data:
- Hover over the column header (like Action Status or Due Date).
- Select the caret icon (▾) or right-click.
- Choose:
- Sort ascending (A → Z)
- Sort descending (Z → A)
Filtering Data
Filters apply instantly and remain until cleared or reset.
To filter data using the column menu:
- Hover over a column header and select the caret icon.
- Choose Filter from the dropdown.
- Select filter criteria (e.g., Status = Open or Priority = High).
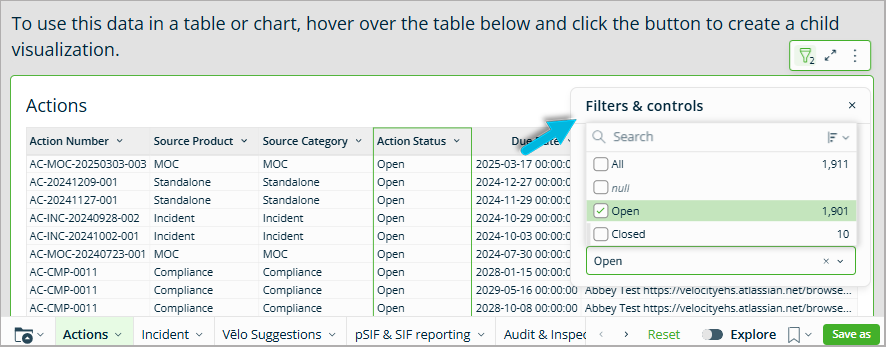
Or use the Filters & Controls panel:
- Select the funnel icon in the top-right corner.
- Use the search box or checkboxes to apply filters.
Grouped Data and Collapsing Views
Reports may be grouped by a key column, like Audit Status or Action Category. This helps organize your data and show rollups like totals or counts.
To interact with groups:
- Select the (+) or (–) icons to expand or collapse grouped rows.
- Right-click a group column and select Group column to re-group or modify the view (if enabled).
Grouped reports may also display summary rows for:
- Subtotals by group (e.g., total open audits by status)
- Grand totals at the bottom of the table
Column Options (View Only)
When hovering over a column and selecting the dropdown or right-clicking, you’ll see options like:
- Rename column
- Hide column
- Freeze column
- Column details
