

What are Advanced Dashboards and Reports?
Reports vs. Dashboards Overview
Understanding the differences between dashboards and reports helps you choose the right tool for your needs.
Dashboards are designed for broad visibility and engagement. They help users quickly understand key safety trends without requiring deep data analysis.
Reports are designed for deeper analysis. They help administrators and authorized users review detailed data, apply filters, identify trends, and support decision-making.
Dashboards: High-Level Visibility for Everyone
Dashboards give you and your team the insights you need to stay informed and take proactive steps without requiring deep data analysis:
- Purpose: Dashboards provide overviews of trends, incidents, and critical safety insights. They are designed to promote situational awareness across the workforce.
- Visibility: Dashboards are accessible to all users by default.
- Primary use: Dashboards help users quickly view key safety metrics and performance indicators with charts.
- Secondary use: They support management oversight by offering a broad snapshot of safety trends across locations or departments.
- Key features:
- Predefined widgets displaying important safety metrics
- Location-specific views to target information based on your site or role
- Highlights of key performance indicators (KPIs) to drive engagement
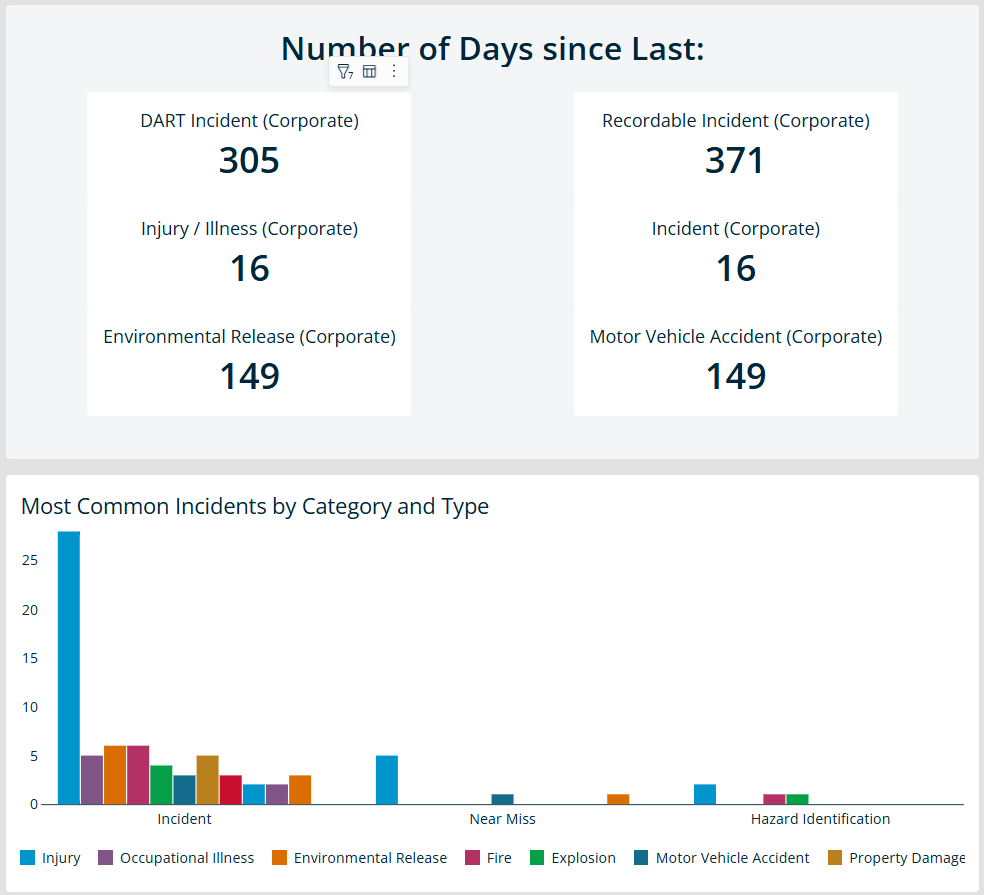 *Example of Advanced Dashboard showing: 1) Key Metrics of your incidents reported at your location. 2) A visual breakdown of incident types, helping you stay aware of common risks.
Reports: Deep Analysis for Administrators
Reports help you move from big-picture observations to detailed, actionable insights:
- Purpose: Reports allow for in-depth exploration of safety data. They help you investigate trends, review compliance gaps, and identify areas for improvement.
- Visibility: Reports are available to administrators by default. Access can be adjusted for other authorized users based on your organization’s internal needs and role permissions
- Primary use: Reports support targeted trend analysis, incident investigations, and compliance reviews.
- Secondary use: They provide operational insights that help teams design focused safety interventions.
- Key features:
- Analyze and filter data to uncover deeper insights
- Compare data across locations, departments, or other fields
- Presents tables and data sets beyond predefined dashboard widgets
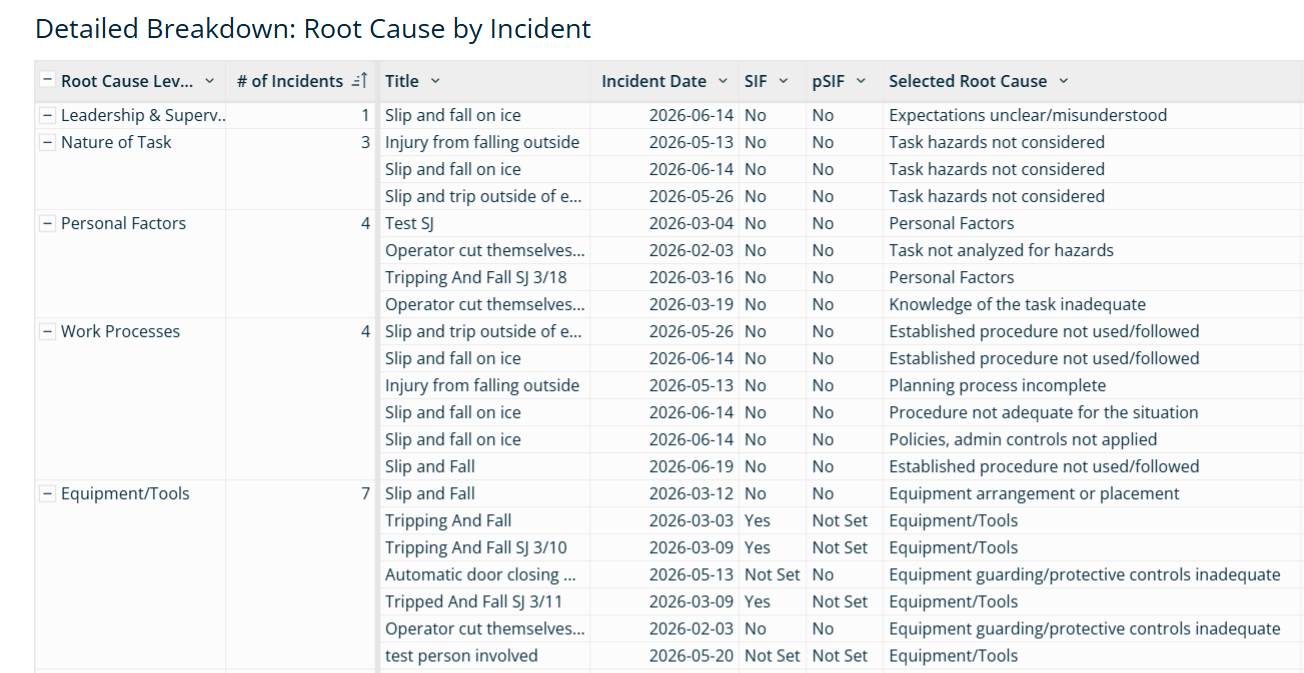 *Example of Advanced Report showing: 1) Grouped Incidents records by Root Cause Level. 2) Identify Incident records over the past six months.
Role Management for Advanced Dashboards and Reports
Role | Default Access |
General Users | Can: View dashboards, apply temporary filters, also explore underlying data. Cannot: Create, modify, or share dashboards or reports. |
Administrators | Can: Create, edit, save, and share dashboards and reports. They have full access to explore and interact with all available data views. |
Users who need to create or edit content must be assigned a role that includes the Policy Explore Reporting Data permissions:
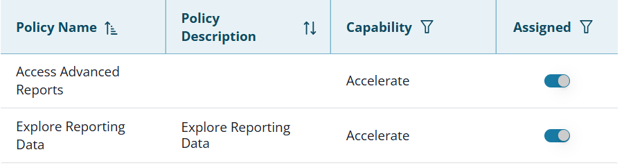
See Accelerate Roles and Permissions for more information.
Advanced Dashboards and Advanced Reports include prepopulated templates with charts and reports built from your Accelerate data. Use these templates to start tracking key metrics and identifying trends without creating dashboards and reports from scratch.
