

Default Dashboards and Reports
Default Dashboards and Reports are ready-to-use workbooks that help you quickly monitor performance, identify trends, and analyze your Accelerate data without building dashboards or reports from scratch.
Advanced Dashboards and Advanced Reports include prepopulated workbooks containing charts and tables that display key performance indicators (KPIs) across your Accelerate solutions. These workbooks are provided as Default Dashboards in Advanced Dashboards and Default Reports in Advanced Reports.
You can use Default Dashboards and Reports to:
- Monitor important KPIs from the moment you sign in.
- Filter data to focus on the information most relevant to your role.
- Share dashboards and reports with other users.
- Use existing charts and tables as a foundation for creating customized dashboards and reports.
Access Default Dashboards and Reports
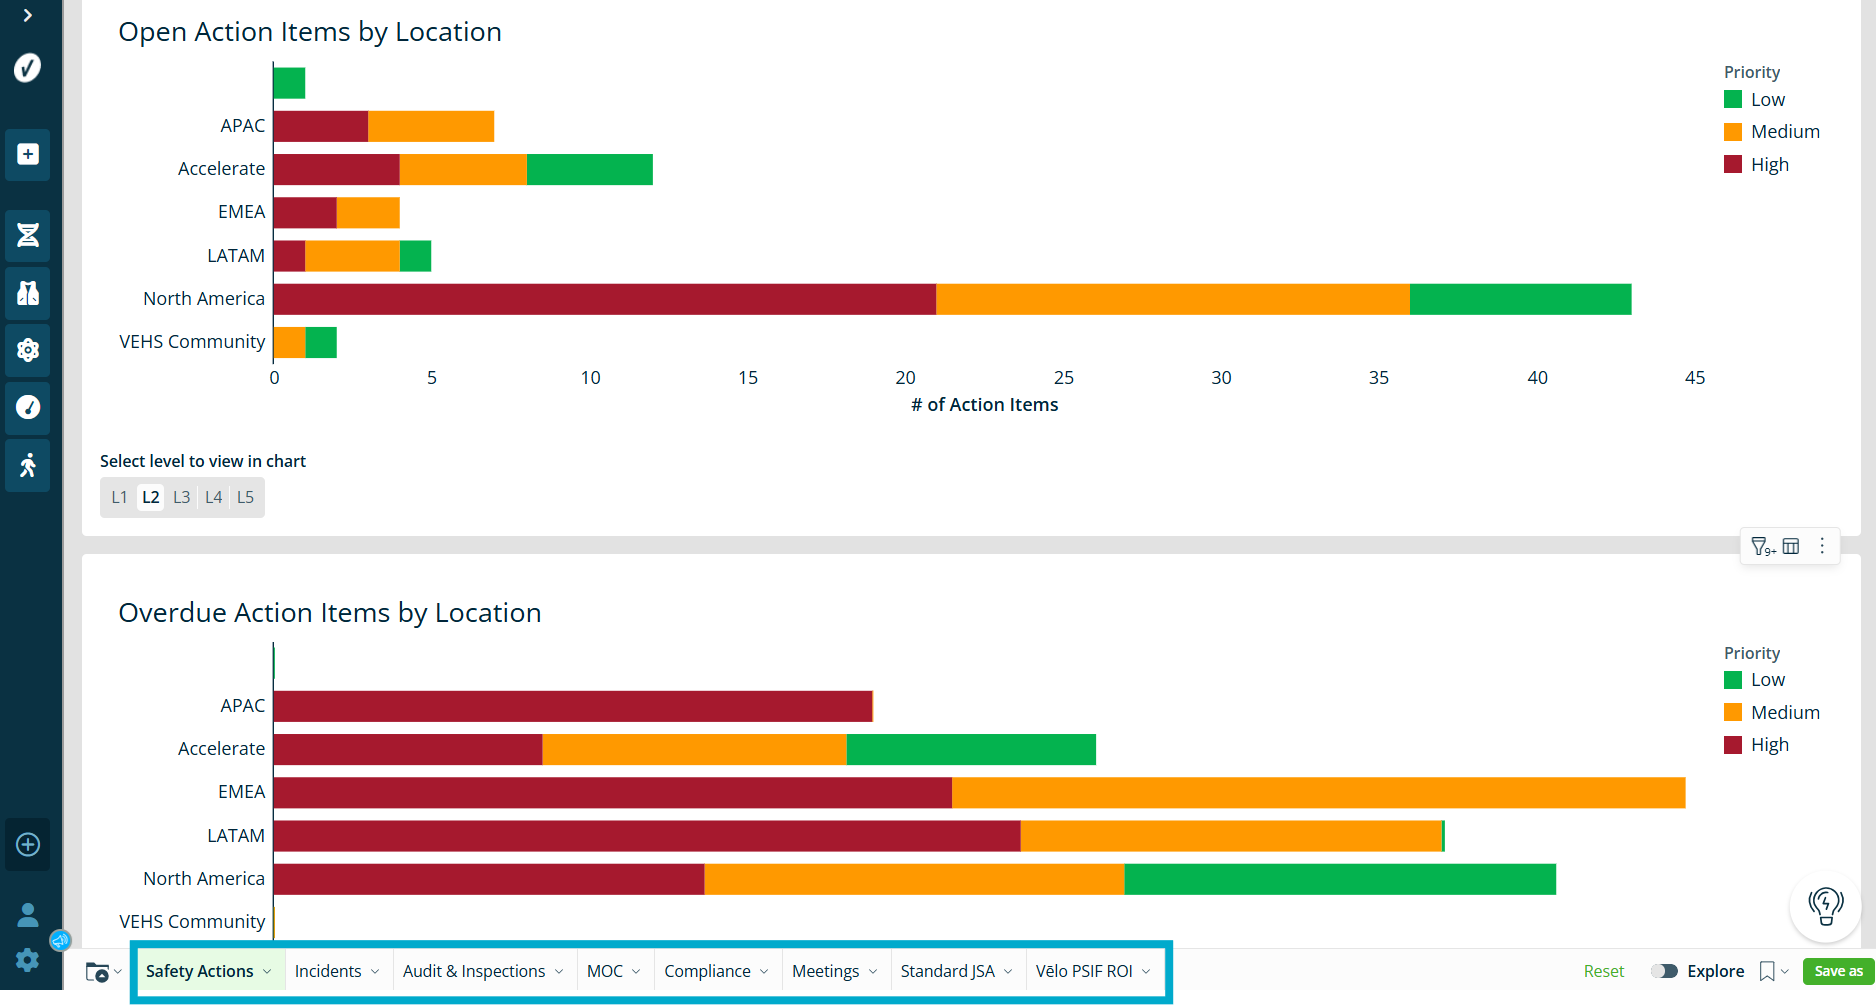
When you open Advanced Dashboards or Advanced Reports in Accelerate, the default workbook opens first.
Each workbook includes pages that organize charts and tables by solution. For example, you may see pages for Safety, Incidents, Inspections, Audits, or other solutions available in your Accelerate environment.
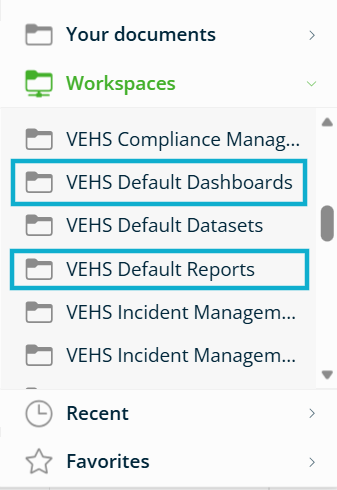
You can also access dashboards and reports through folders. Folders help you organize, store, and find dashboards and reports.
You can use folders to:
- Organize related workbooks.
- Share content with other users.
- Manage personal and team dashboards.
To learn more about solution-specific dashboards and reports, see Solutions in Accelerate’s Dashboards and Reports.
For more information about folders, see Folders – Saving, Organizng and Sharing your Dashboards and Reports.
Apply Filters and Controls
Filters help you narrow the data shown in a dashboard or report so you can focus on the data you need.
You can use filters to:
- Turn predefined filters on or off.
- Select values from drop-down menus.
- Create your own filters using the + icon.
Common Filters include:
- Date range
- Location
- Status
- Incident type
- Risk category
Advanced filters help you focus on high-priority items, reduce clutter in large datasets, and find trends faster.
Common advanced filters include:
- Top N
- Exclude Value Filters
- Location Hierarchies
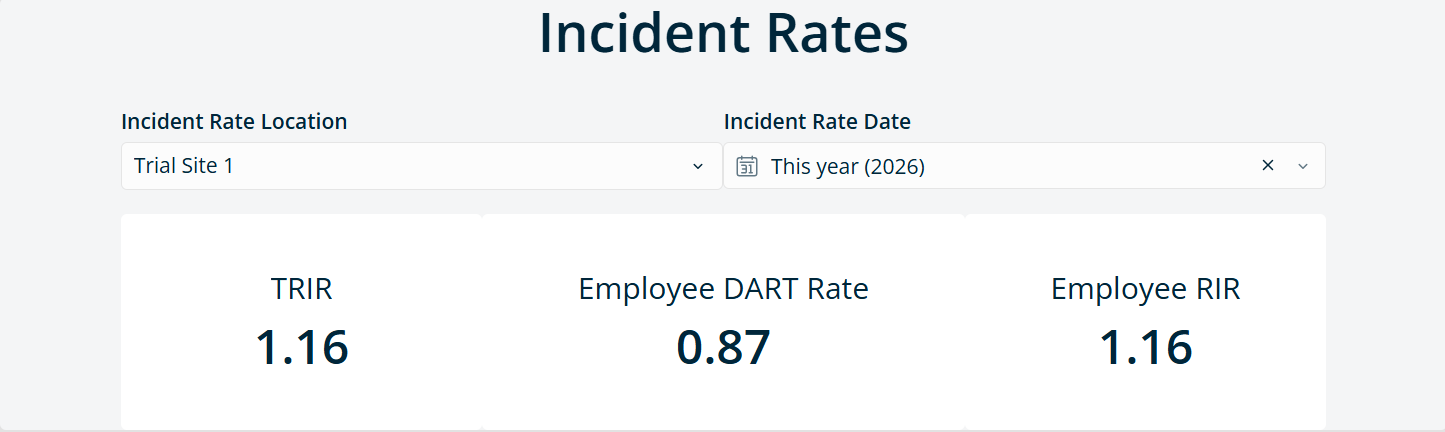
Controls work like filters, but they can update multiple charts and tables at the same time. Filters usually apply to one chart or table. Controls are usually placed outside the chart or table and can update an entire page or workbook.
For example, an Incident Rate Date control can update multiple Incident Rate visualizations at the same time.
Save a Copy of a Default Workbook
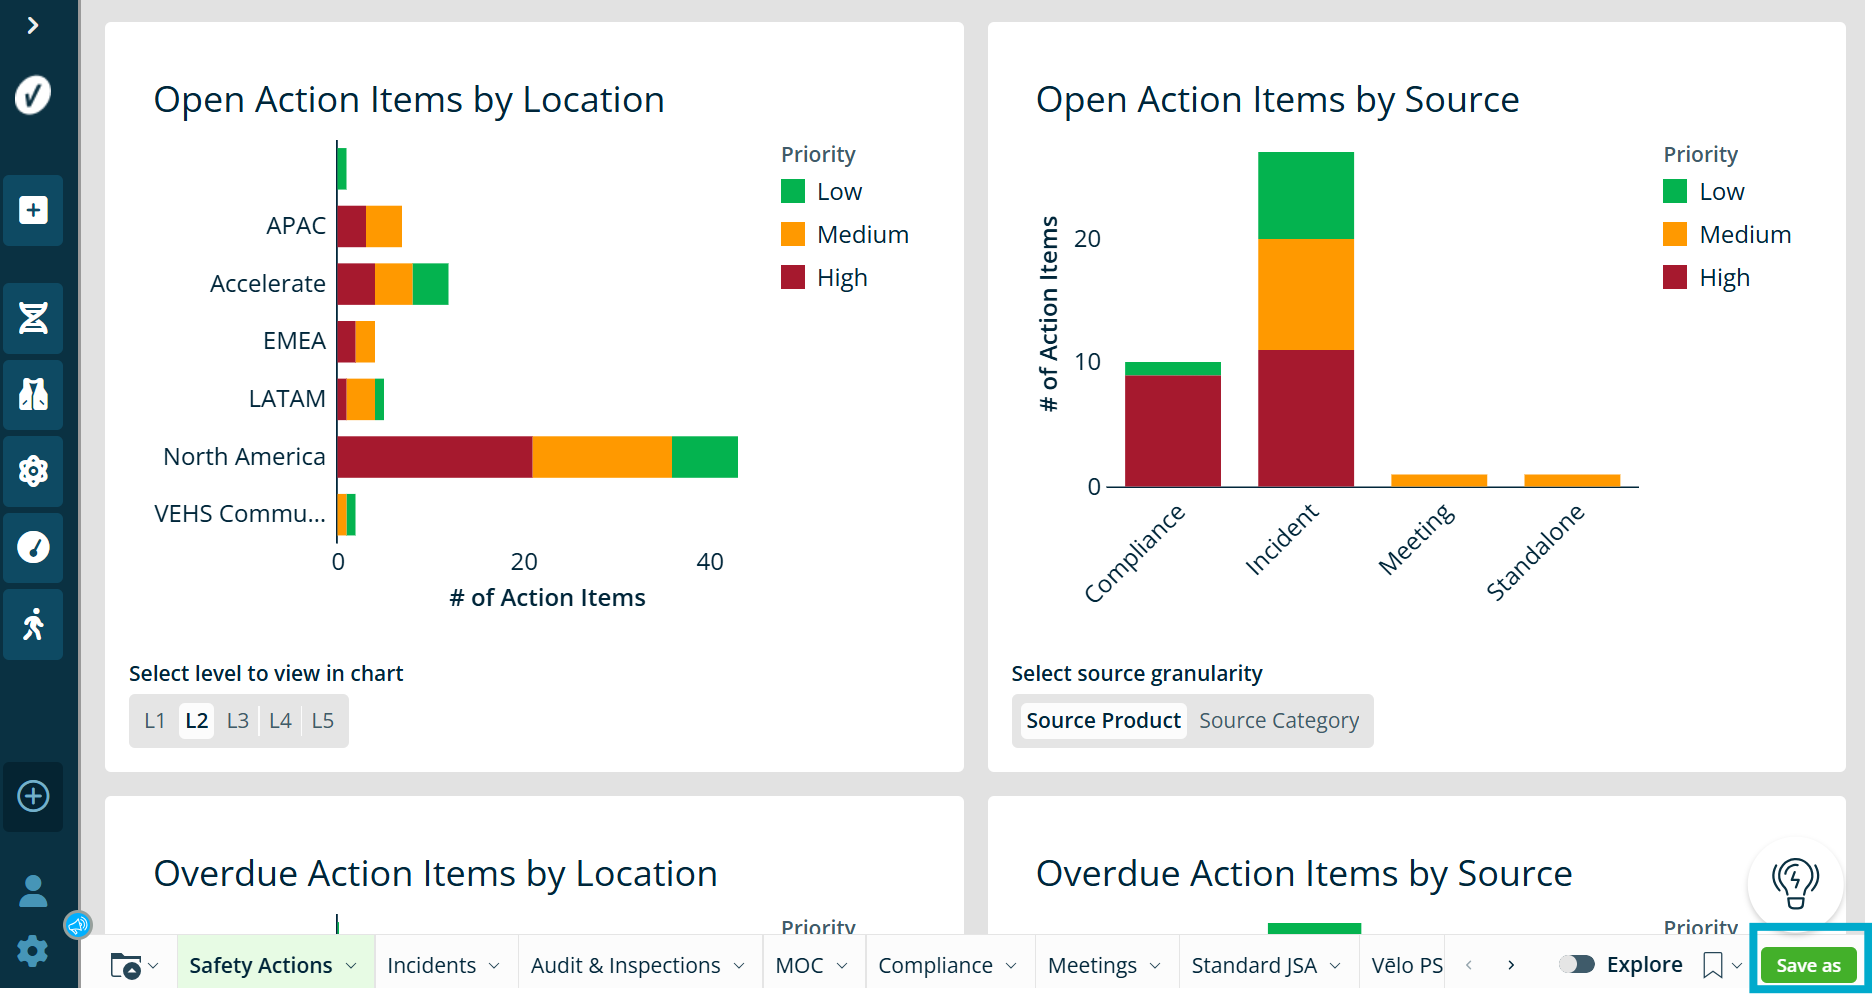
Default Dashboards and Default Reports cannot be edited directly.
To make changes, create a copy of the workbook:
- Select Save As.
- Enter a name for the workbook.
- Choose a folder where the workbook should be saved.
- Select Save.
To keep a workbook private, save it in My Documents. You can move it to a shared workspace later.
The original default workbook does not change. You can always return to it as a starting point.
Administrators can customize dashboards and reports by creating and editing workbook copies. For more information, see Customizing Advanced Dashboards and Reports.
To learn more about creating your own dashboards and reports, see Creating a New Advanced Dashboard.
