

VelocityEHS PSIF Practical Guide
Potential Serious Incidents and Fatalities (PSIF) serve as a leading indicator, helping you identify catastrophic risks before they result in a Serious Injury or Fatality (SIF). They provide insight into high-risk activities and conditions that could impact your people and your organization.
Because PSIFs focus on events that have not yet happened, it can be difficult to measure their impact. You may ask:
- Are your safety actions reducing risk?
- Is it worth investing in these efforts?
The VelocityEHS Vēlo PSIF ROI Dashboard helps answer these questions. It uses your PSIF data to estimate the financial impact of preventing serious incidents, so you can better understand the value of your safety efforts.
Understand the Value of the Vēlo PSIF ROI Dashboard
The dashboard helps you:
- Identify hidden risk
PSIFs often go unnoticed because no serious injury occurs. The dashboard surfaces these high-risk situations so you can take action.
- Support investment decisions
Safety efforts are not always tied to clear business outcomes. The dashboard helps you show the financial value of prevention.
- Improve risk control
Better visibility into risk helps you implement more effective corrective actions.
- Prevent major incidents
High-risk events can lead to serious injuries, equipment damage, or production downtime even when one is injured.
Explore Your ROI Dashboard
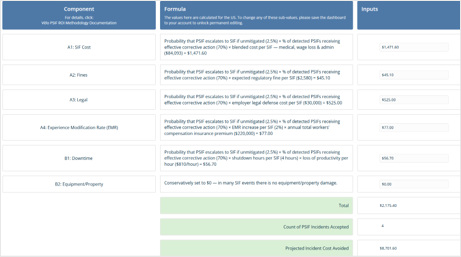
Your Vēlo PSIF Advanced Dashboard shows the estimated costs associated with PSIF-related incidents. This helps you gauge the value of your prevention efforts.
Use Filters to Refine Your Data
Use Filters in your dashboard to control which PSIF incidents are included in your calculations. These filters update the Count of PSIF Incidents Accepted, which directly impacts your ROI calculations.
You can filter by:
- PSIF Date: Select any date range to include your PSIF data
- Locations: Include PSIF data from one or multiple locations


Understand How ROI Is Calculated
The dashboard estimates the cost your organization avoids by preventing serious incidents.
Potential SIF consequences are organized into two categories:
Pillar A: Safety and compliance costs
These costs relate directly to injuries and regulatory impact:
- A1 – SIF Risk: Estimates the cost if PSIFs result in serious injuries or fatalities
- A2 – Fines: Includes penalties from regulatory authorities
- A3 – Legal: Covers legal and investigation costs
- A4 – Experience Modification Rate: Reflects how safety performance impacts workers’ compensation premiums
Pillar B: Operational costs
These costs relate to business disruption:
- B1 – Downtime: Estimates costs from production delays or stoppages
- B2 – Equipment/Property: Estimates costs related to damaged equipment or property
Customize Your ROI Calculations
You can update any input field in the ROI components to better reflect your organization’s data.
This allows you to:
- Use internal cost estimates
- Adjust assumptions
- Improve accuracy based on your operations
To learn more about our estimation criteria in your component’s formulas check out our complete guide: View Practical Guide
