

Advanced Dashboard and Reports for Operational Risk
Accelerate Advanced Dashboards and Reports provide customizable, comparative analytics that turn static data into a strategic management resource. These tools enable you to analyze performance across sites and time periods, identify trends, and make proactive improvements in a user-friendly and visual interface. You can manipulate the data in an infinite number of ways. The dashboards and reports reflect data from all Accelerate solutions your organization has purchased.
For background information about Accelerate Dashboards and Reports, see Getting Started with Advanced Dashboards and Reports.
This article describes the Advanced Dashboard and Reports available for Operational Risk on Accelerate. While you can continue to track performance in the existing Operational Risk dashboard and reports throughout the system, these advanced tools improve visibility into risk, actions, and global item usage across the organization. By consolidating data from risk worksheets, job safety analysis, and bowties, these insights help teams better identify high-risk areas, track execution, and make more informed decisions.
Operational Risk Advanced Dashboard Elements
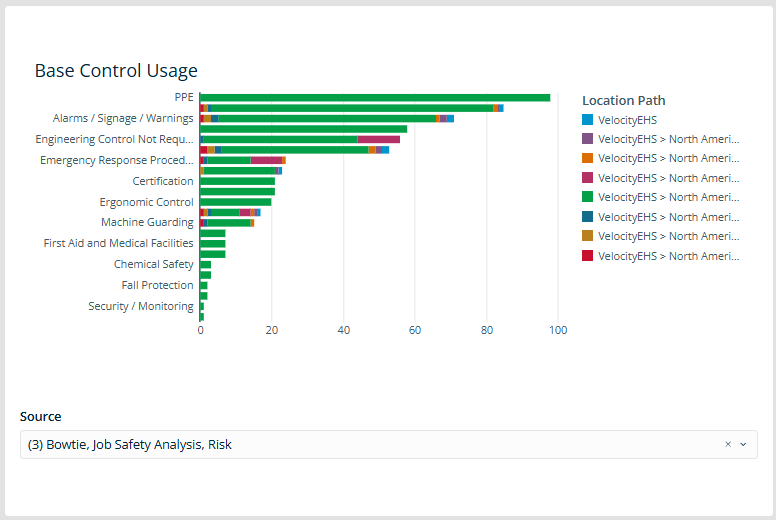
Global Item Usage
This dashboard element provides a consolidated view of global item (causes, controls, hazards) usage across the organization, showing which ones are used most often. You can filter the data by risk worksheets, job safety analysis, and/or bowties. This data helps teams quickly identify high-impact items that may require standardization or prioritization. From here, you can designate critical items to focus attention and drive consistency. The key value is visibility, turning distributed data into a clear view of what matters most.
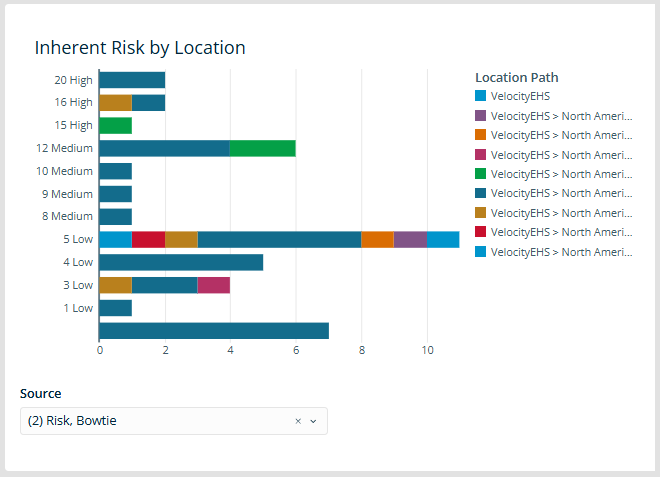
Risk by Location
This dashboard element shows how risk is distributed across locations, highlighting areas with higher concentrations of risk. You can quickly see the number of high-risk items and where they are concentrated. You can filter the data by risk worksheets, bowties, or both. This allows teams to focus on the highest-risk areas and take targeted action. The result is better prioritization and more effective risk management.
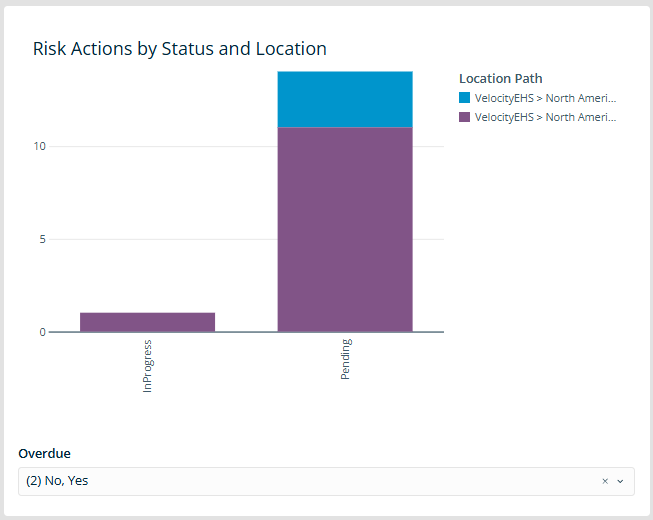
Action Status by Location
This dashboard element provides visibility into actions across both risk worksheets and job safety analysis. You can see how many actions are pending, in progress, or completed across locations, and can choose to include/exclude items that are overdue. This helps you quickly identify gaps in follow-up and where action is required. Because it spans both risk and JSA, it provides a more complete view of execution across the organization. The result is better tracking, stronger accountability, and improved follow-through on safety actions.
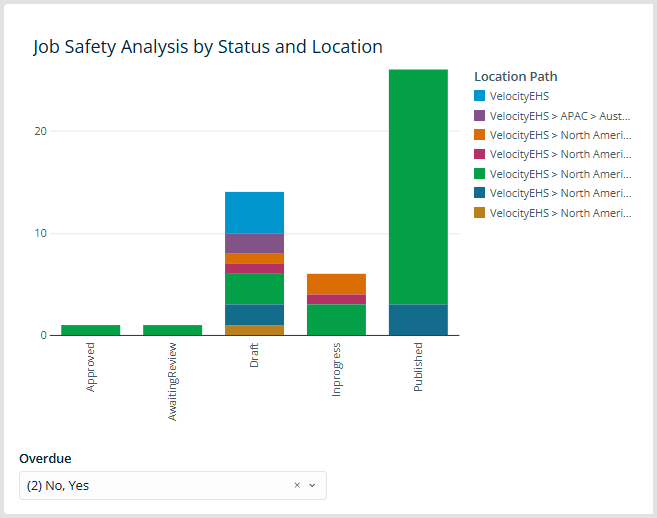
Job Safety Analysis Status by Location
This dashboard element shows job safety analysis items by status across locations so you can track progress through the workflow, such as draft and approved stages. You can also choose to include/exclude items that are overdue. Tracking progress helps you identify bottlenecks and ensure JSAs are moving through the process. The result is improved workflow management and consistency.
For more about navigating and customizing an Advanced dashboard, see Advanced Dashboard.
Operational Risk Advanced Reports
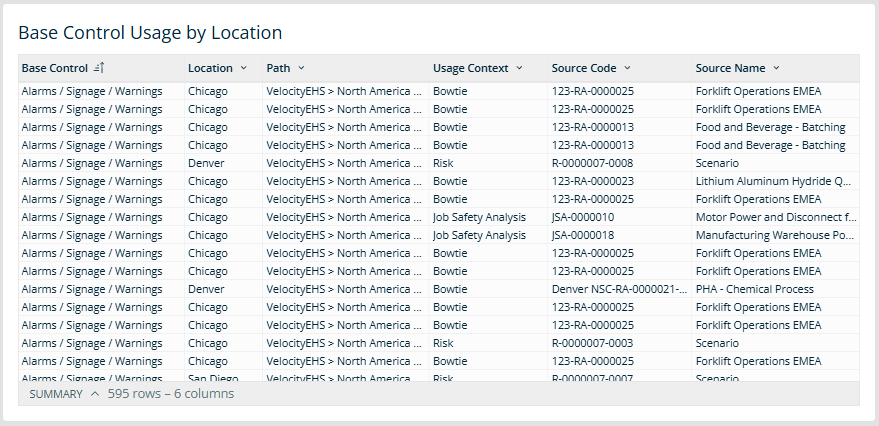
Global Item Usage by Location Report
This report shows where global items are used across risk worksheets, job safety analysis, and bowties, providing full traceability from the global item down to the specific records where it is applied. It helps validate consistency, identify gaps, and support standardization across the organization. The result is greater control over how critical safety elements are defined and used.
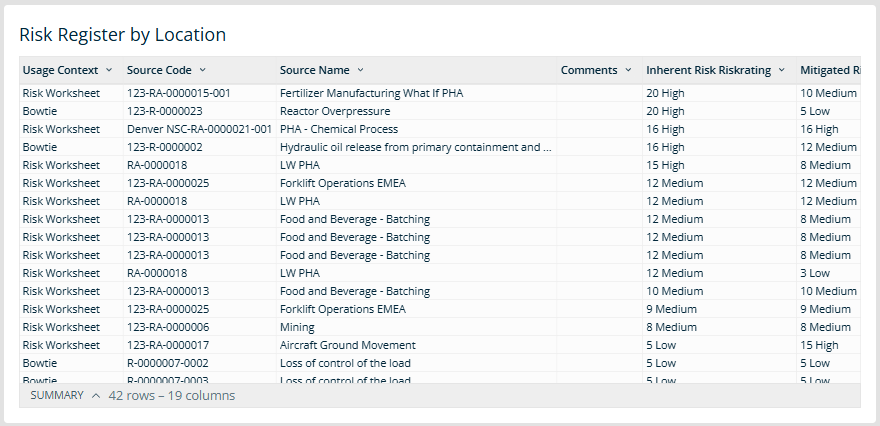
Risk Register by Location Report
This report provides a consolidated view of current risk exposure across risk worksheets and bowties, including inherent and mitigated risk. It acts as a centralized risk register, bringing together key details such as risk ratings, location, and context. Because it spans multiple sources, it provides a complete picture of risk across the organization. The result is improved visibility, easier reporting, and better support for reporting and audits.
For more about navigating and customizing advanced reports, see Advanced Reports.
How to Access Operational Risk Advanced Dashboard and Reports
- Go to Platform > Advanced Dashboard (or Advanced Reports).
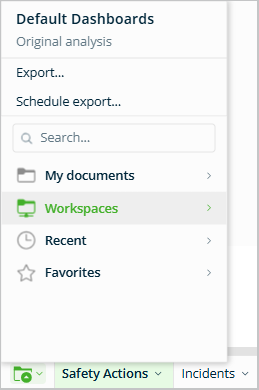
- Expand the folder icon at the bottom left of the page and select Workspaces.
- Find VEHS Operational Risk Dashboards (or VEHS Operational Risk Reports) and click on it.
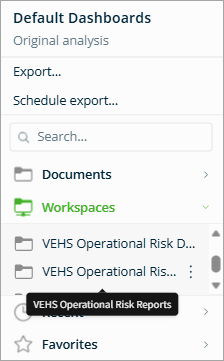
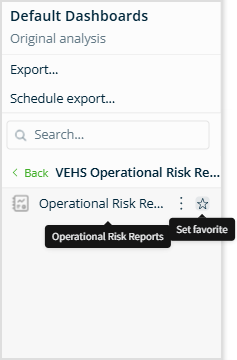
- Hover over it and select the star icon to save it to your Favorites list for easy future access. Then click on the dashboard (or report) to open it.
FAQs
- Can I set the Operational Risk Dashboard or Reports as my default page? No. However, you can set them as “favorites” (see above), or choose Save as at the bottom right of the page so that it appears under My Documents for quicker future access.
- Why is my dashboard not displaying any data? There may be no records within the selected date range. Adjust the range using the filter options and refresh the page.
