
Product Quantity Report
The Product Quantity Report is only available for SDS Management and Chemical Management.
The information in this article is specific to the Product Quantity Report. If you need information on reports in general see Reports Overview.
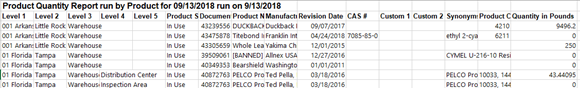
The Product Quantity report shows the quantity in pounds for products in your eBinder on a specific date.
Note that this report will only include results for products for which you have created containers. If the product is a liquid or gas you will also need to index the relative density/specific gravity or relative vapor density or gas density as appropriate otherwise the quantity in pounds will show as zero (0). See Creating and Managing Containers and Physical Properties Indexing for more information.
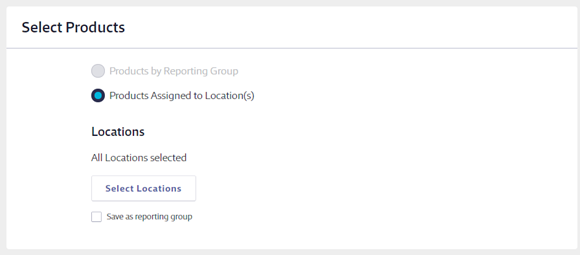
Select Products
By default, all locations are selected. To choose specific locations, click the Select Locations button.
If you have created reporting groups, you can select Products by Reporting Group which allows you to select a reporting group from the drop-down menu. If you have not created reporting groups this option will be grayed out. See Creating Reporting Groups for more information.
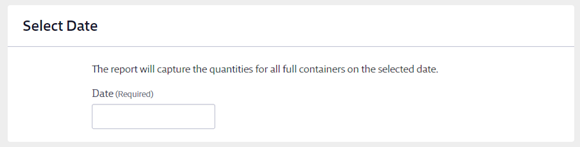
Select Date
The report must be run for a specific date and will capture the quantities for all Active containers on that date.
Click in the field to bring up a calendar. Use the calendar to select the date.
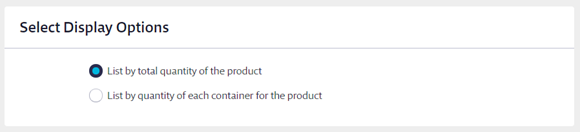
Select Display Options
Select how you want the data to display.
List the total quantity of the product will add the amounts remaining in all Active containers of that product together and report the weight in pounds.
List quantity of each container for the product will list each container individually.
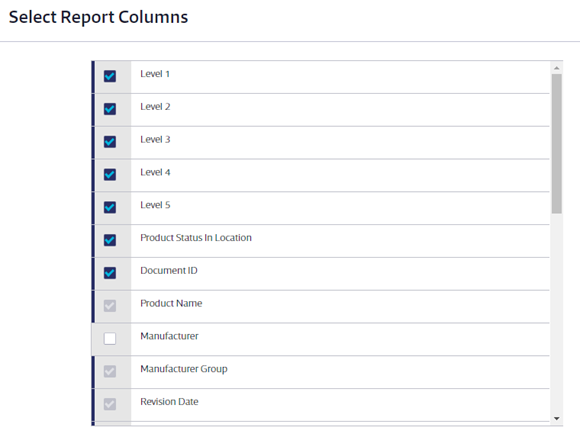
Select Report Columns
Once you’ve selected which products to include in the report, choose the data that you would like to appear in the report columns for each container.
Some columns will be required and cannot be unchecked. You can select as many additional columns as you need.
If you selected List quantity of each container for the product, you can choose “Quantity on Hand” as a column. This will display the most recent Amount Remaining closest to the date when the report was run. For example, if the report was run on June 1 and the Inventory Data section has entries for Jan 1, Feb 1, March 1, and April 1, the Quantity on hand will be the April 1 entry since it is closest to June 1.
Once you’ve made all of the selections for your Product Quantity Report, click the Run Report button at the bottom of the page.