

Ingredient Quantity Summary Report
The Ingredient Quantity Summary Report is only available for SDS Management and Chemical Management accounts.
The information in this article is specific to the Ingredient Quantity Summary Report. If you need information on reports in general see Reports Overview.
The Ingredient Quantity Summary report shows combined quantities of your ingredients for products in your eBinder for a specific date.
Note that this report will only include results for products for which you have indexed ingredients and created containers. See Ingredient Indexing and Creating and Managing Containers for more information.
The ingredient quantity is calculated by multiplying the total container weight by the ingredient’s % by weight. The % by weight is the upper end of the range when “Between” is selected; 100% when “Greater Than” is selected; and the amount entered when “Less Than” or “Equal To” are selected. If the % by weight is not entered or you select N/A when indexing the ingredients then the quantities cannot be calculated.
Select Products
By default, all locations are selected. To choose specific locations, click the Select Locations button.
If you have created reporting groups, you can select Products by Reporting Group which allows you to select a reporting group from the drop-down menu. If you have not created reporting groups this option will be grayed out. See Creating Reporting Groups for more information.

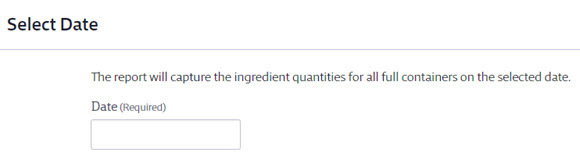
Select Date
The report must be run for a specific date and will capture the ingredient quantities for all Active containers on that date.
Click in the field to bring up a calendar. Use the calendar to select the date.
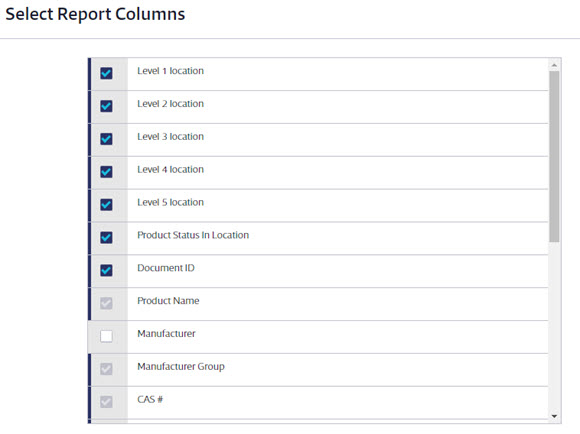
Select Report Columns
Once you’ve selected which products to include on the report, choose the data that you would like to appear in the report columns for each container.
Some columns will be required and cannot be unchecked. You can select as many additional columns as you need.
Once you’ve made all of the selections for your Ingredient Quantity Summary Report, click the Run Report button at the bottom of the page.
Containers for a product with the same unit of measure will have their quantities combined to give the total quantity in the selected locations.
Quantity on Hand will display the most recent Amount Remaining closest to the date when the report was run. For example, if the report was run on June 1 and the Inventory Data section has entries for Jan 1, Feb 1, March 1, and April 1, the Quantity on hand will be the April 1 entry since it is closest to June 1.
Quantity in Pounds calculates only if you’ve indexed specific gravity or vapor density as appropriate for your products.
