

Health and Safety Statistics Report
If you’re using our Incident Management module, you may be interested in generating reports to help you gain insights into your incident management program. Our Incident Reports can be particularly helpful in this regard, allowing you to generate a variety of useful reports. In this article, we’ll walk you through the steps to generate a Health and Safety Statistics Report, which can help you analyze trends and identify areas for improvement in your organization’s health and safety program.
How to Generate Reports
Access
To access the Incident Reports, select Monitor > View All Reports.
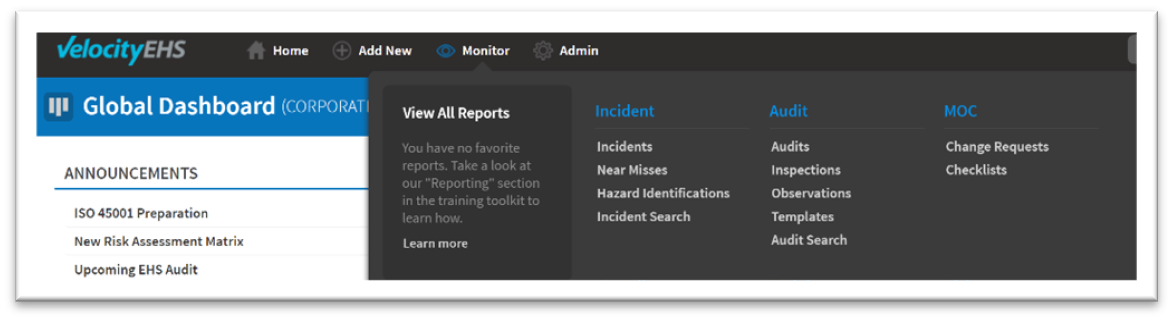
Then select Incident Reports from the menu options on the left sidebar (also known as the index). Then select the Health & Safety Statistics report from the list of available reports.
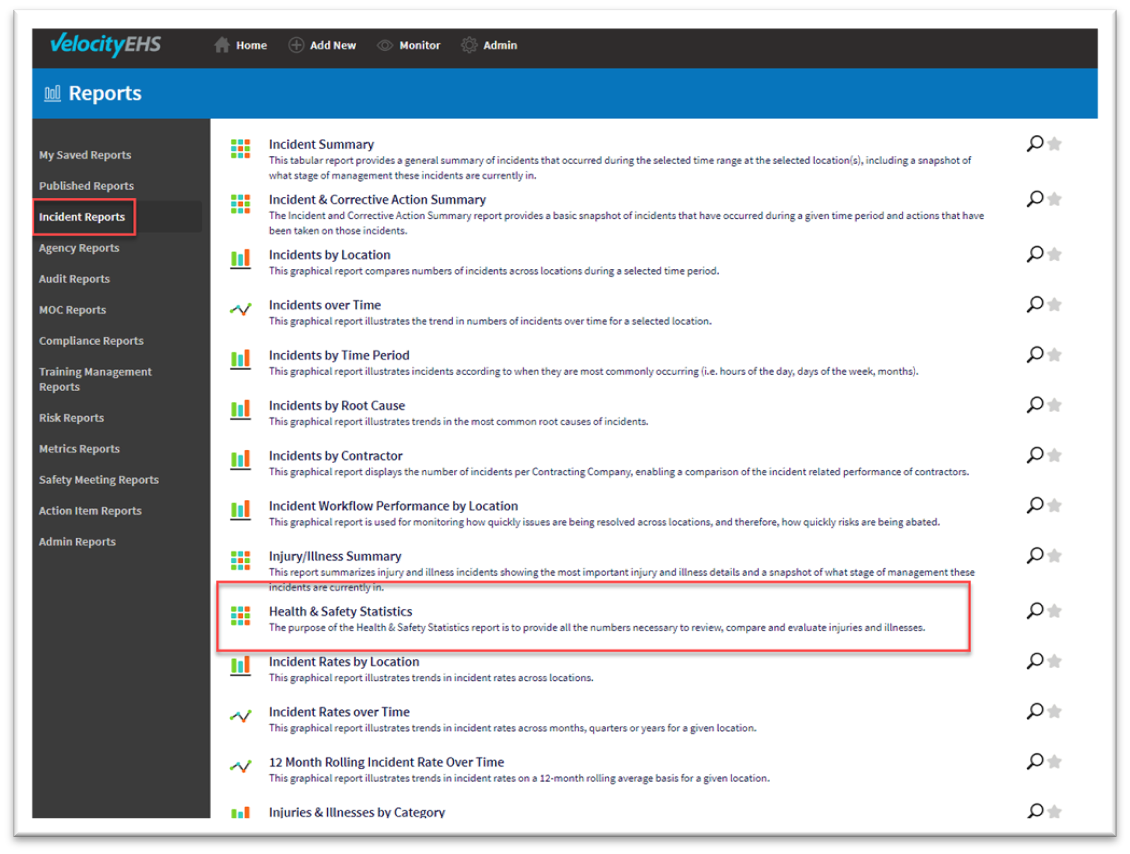
Once selected, you can review the report’s parameters to ensure it meets your reporting requirements.
Parameters/Filters
You can select from the following parameters:
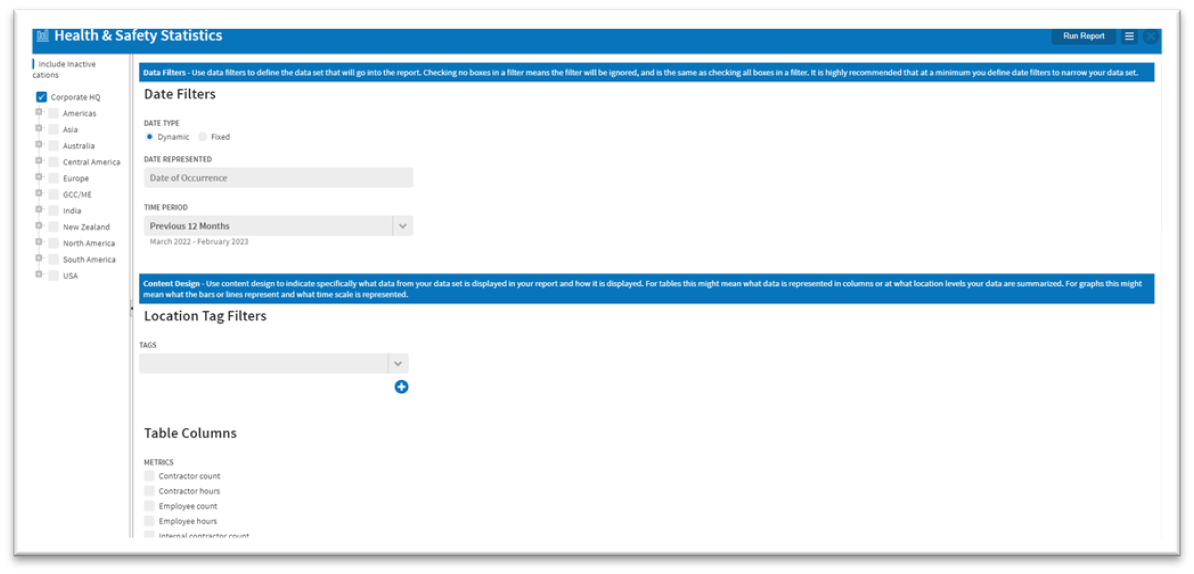
Date Filters
In the Health & Safety Statistics report, the primary date used is the Date of Occurrence for the Date Represented. This means that the report will only display incidents that occurred within the selected date range.
There are two options for selecting a date range: Dynamic and Fixed.
Location Tag Filters
If your company uses location tags, you can filter the data by selecting them in the left sidebar. It’s recommended to only select the top of the location tree (level 1) to prevent unwanted filtering when applying the tags.
When selecting multiple location tags from the first dropdown, an OR logic will be applied, meaning that all records with any of the location tags will be included. If you use the Add Another feature (plus symbol) to include additional location tags, they will apply an AND logic and require that both location tags apply.
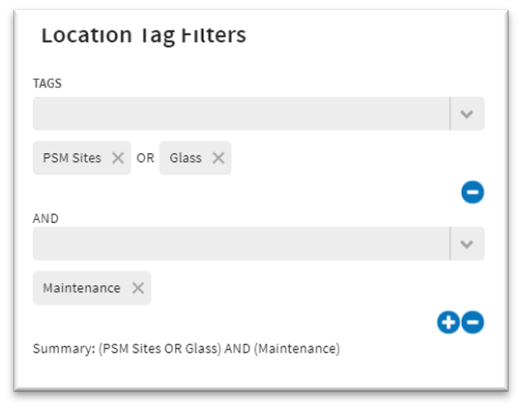
Using the example above, the system will include locations that are tagged as (PSM Sites OR Glass) AND Maintenance.
Table Columns
To determine what information populates the columns of the report, you can use the parameters provided. At least one selection must be made to generate the report.
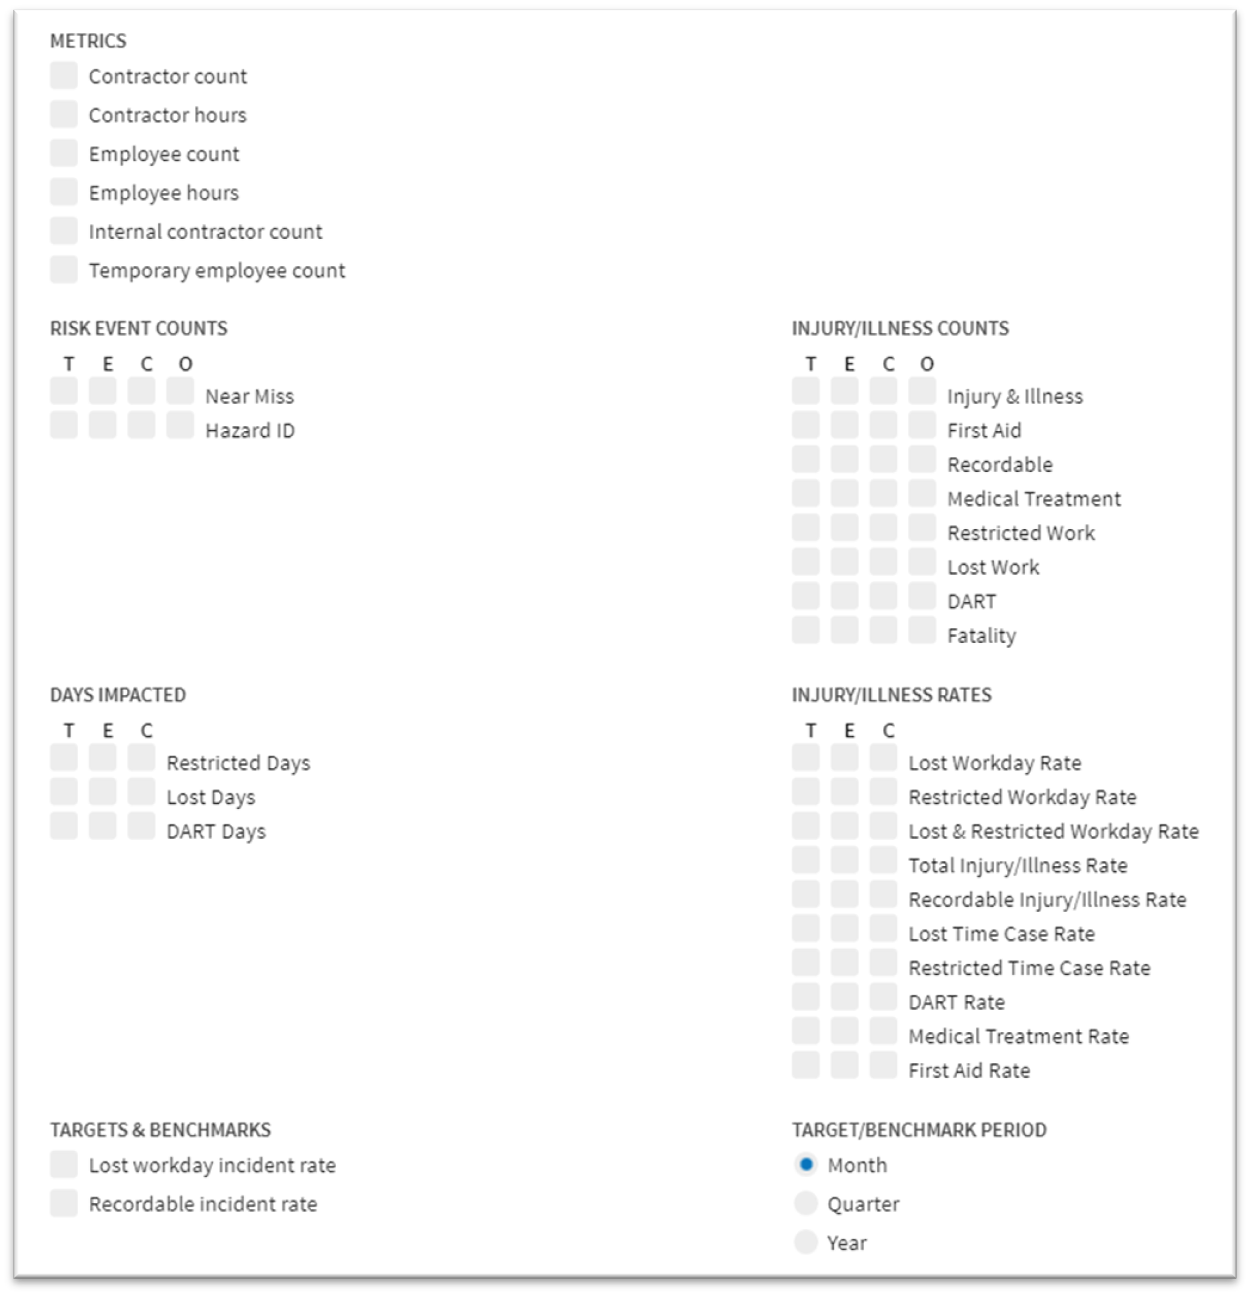
The data is divided into seven categories, and each has several options to choose from:
- Metrics
- Risk Event Counts
- Days Impacted
- Targets & Benchmarks
- Injury/Illness Counts
- Injury/Illness Rates
- Target/Benchmark Period
You can use the T, E, C, and O options to specify the relationship of the person involved. This corresponds to the Relationship of Person Involved field on the First Report form.
- T represents the total number of records
- E provides information for employees
- C provides information for contractors
- O provides information for other (if available).
If you set Targets and Benchmarks in the Admin menu under Incident > Incident Rate Targets, you can select which targets to include and the corresponding period for that target. This allows you to easily compare your actual rates against your targeted rates using this report.
Select the toggles below to review the remaining parameters and filters.
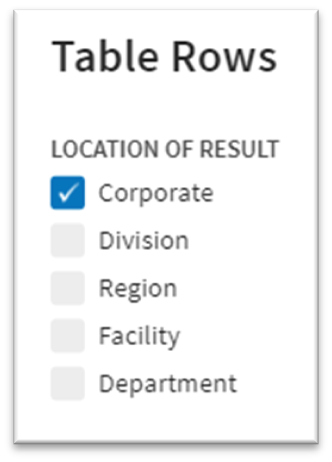
Table rows represent the desired level on the location tree. You can select the levels that you would like represented on the report.
Important: If you only include locations farther down in the location tree, then it will be helpful to include those levels in the Location of Result. Otherwise, the report will return “Nothing matches the selected criteria”.
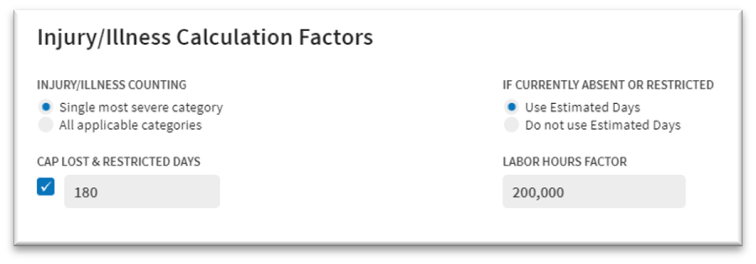
The Injury/Illness Calculation Factors allow you to set key variables used to calculate the metrics for the report.
The default selection for Injury/Illness Counting is "Single most severe category." This ensures that each incident record is counted only once, even if it has multiple categories that apply to it. For example, if an incident has both restricted days and lost days entered, it would be counted once on the report as a Lost Work incident. If "All applicable categories" were selected instead, the incident would be counted twice: once as Restricted Work and once as Lost Work.
The default selection for Cap Lost & Restricted Days is 180 days, and is selected due to OSHA reporting requirements. To use a different limit to the number of days counted, you can update this parameter, or you can uncheck it if you do not want to limit the days counted.
Note: The system combines Lost Time and Restricted Duty days in the count.
The Labor Hours Factor determines the number that the system uses when calculating the incident rate. The incident rate is calculated by multiplying the count of incidents by the labor hours factor and then dividing by the number of hours worked.
Here's the equation:
Incident rate = (count of incidents x labor hours factor) / hours worked
By default, the labor hours factor is set to 200,000, but it can be changed to a different factor if desired.
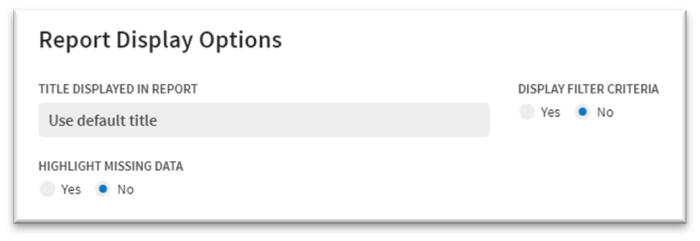
The Report Display Options provide various ways to customize the appearance of the report. You can modify the report title, enable highlighting of missing data, and choose to display the filter criteria used for the report.
Generate and Export
After setting your report parameters, select Run Report located in the top right corner of the screen to generate the report based on the selected criteria.
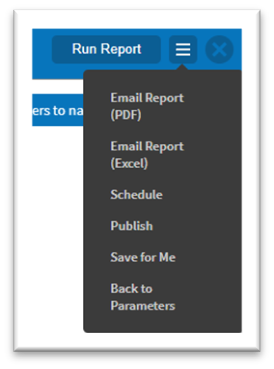 In addition to running the report, you can:
- Email Report as a PDF or Excel file
- Schedule the report to be automatically sent at regular intervals (See Scheduled Reports)
- Publish the report for other users to access
- Save the report for your own reference using Save for Me
- Go back to the parameters to make additional changes.
Calculations
The report generates a rate calculation based on the following formula:
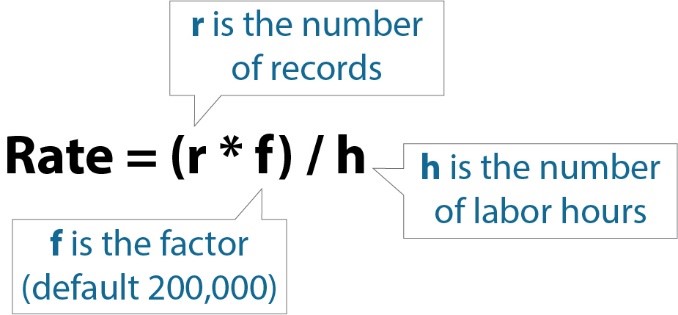 The calculation considers the rate selected and the Relationship of Person Involved chosen. For instance, if the Recordable and E for Employees options are selected, the calculation includes only those records that are marked as recordable in the investigation and have a Relationship of Person Involved as Employee.
As an example, the system would calculate the Recordable Injury/Illness Rate for Employees as follows:
Recordable Injury/Illness Rate for Employees = (count of records where ((Relationship of Person Involved = Employee) and (Recordable Injury/Illness = Yes)) * 200,000) / 2,080,000 hours (example hours which would be entered into the system’s Labor Data)
The system also calculates counts based on similar logic. For example:
Injury & Illness count for Employees = count of records where (incident type = Injury or Illness) and (Relationship of Person Involved = Employee)
