
Metrics and Goals
Download this list of metrics VelocityEHS recommends that you track as part of your ergonomics program, such as risk reduction percentages or number of assessments with identified direct causes.
The Manage > Metrics and Goals options compile data and information from various areas across your account so you can see it all in one place and determine if you’re staying on target and meeting business objectives with regard to ergonomics. Additional metrics can be found in Summary Reports.
Scorecard
The Scorecard provides aggregated data at any level within the organization. It summarizes all Industrial Ergonomics risk reduction, job assessment, and training data.
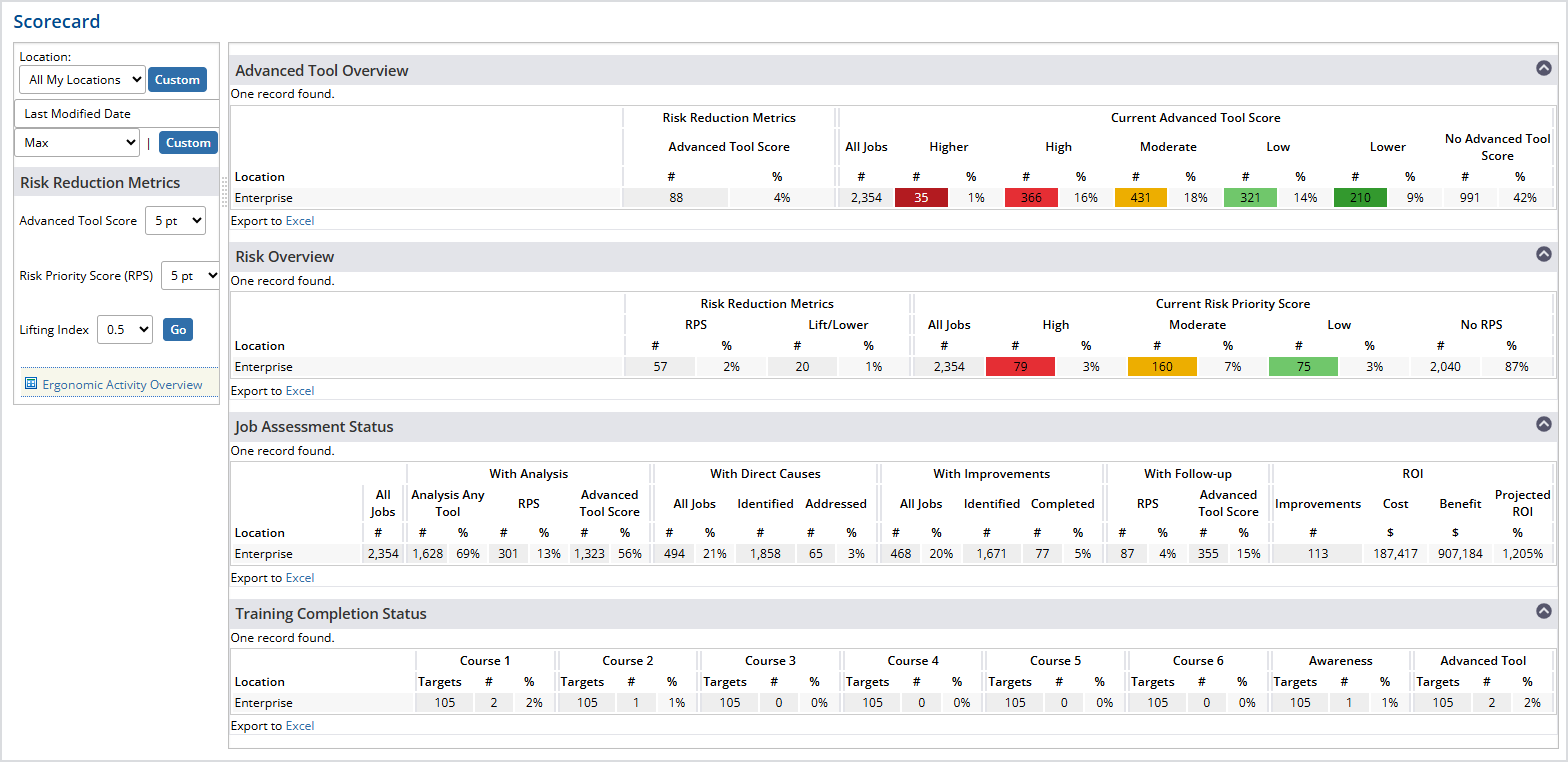
- To filter the data by a specific location, select Custom and then the location(s).
- Select multiple Locations to make real-time comparisons.
- Use the Risk Reduction Metrics options to further filter your results.
- Use the up/down arrows at the right to collapse/expand each data set.
- Select Excel at the bottom of the page to export the data to a Microsoft Excel file.
For a quick glance at ergonomic activity across your organization (number of assessed jobs, percentage of high-risk jobs, and more), select Ergonomic Activity Overview.
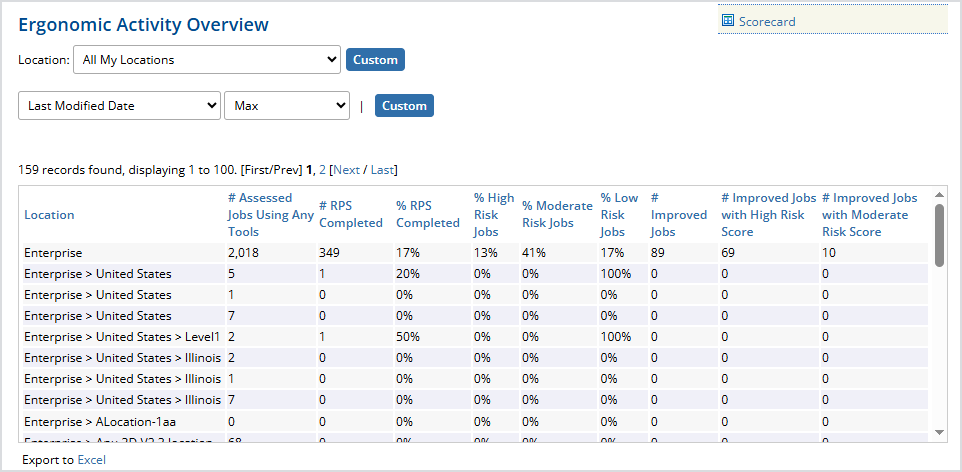
- Select Scorecard to return to the Scorecard page.
- The Excel option is also available here.
Risk Reduction Index
Use the Risk Reduction Index to monitor leading indicators every month.
For your ergonomics improvement process, two systems-based measures, or key performance indicators, are the percent reduction in MSD risk and percent of workstations at low or no risk. The Risk Reduction Index enables you to monitor both of these leading indicators, for job assessments completed using the Advanced Whole-Body Assessment method (ADV) and the Manual Whole-Body Assessment method (RPS), as well as assessments that include a lifting analysis (Lifting Index).
- To filter the data by a specific location, select Custom in the left column, and then selection the location(s).
- Select the appropriate tab (ADV, RPS, Lifting Index) to change your focus.
- For more information about specific areas in this report, hover over any of the information (i) icons.
Risk Reduction
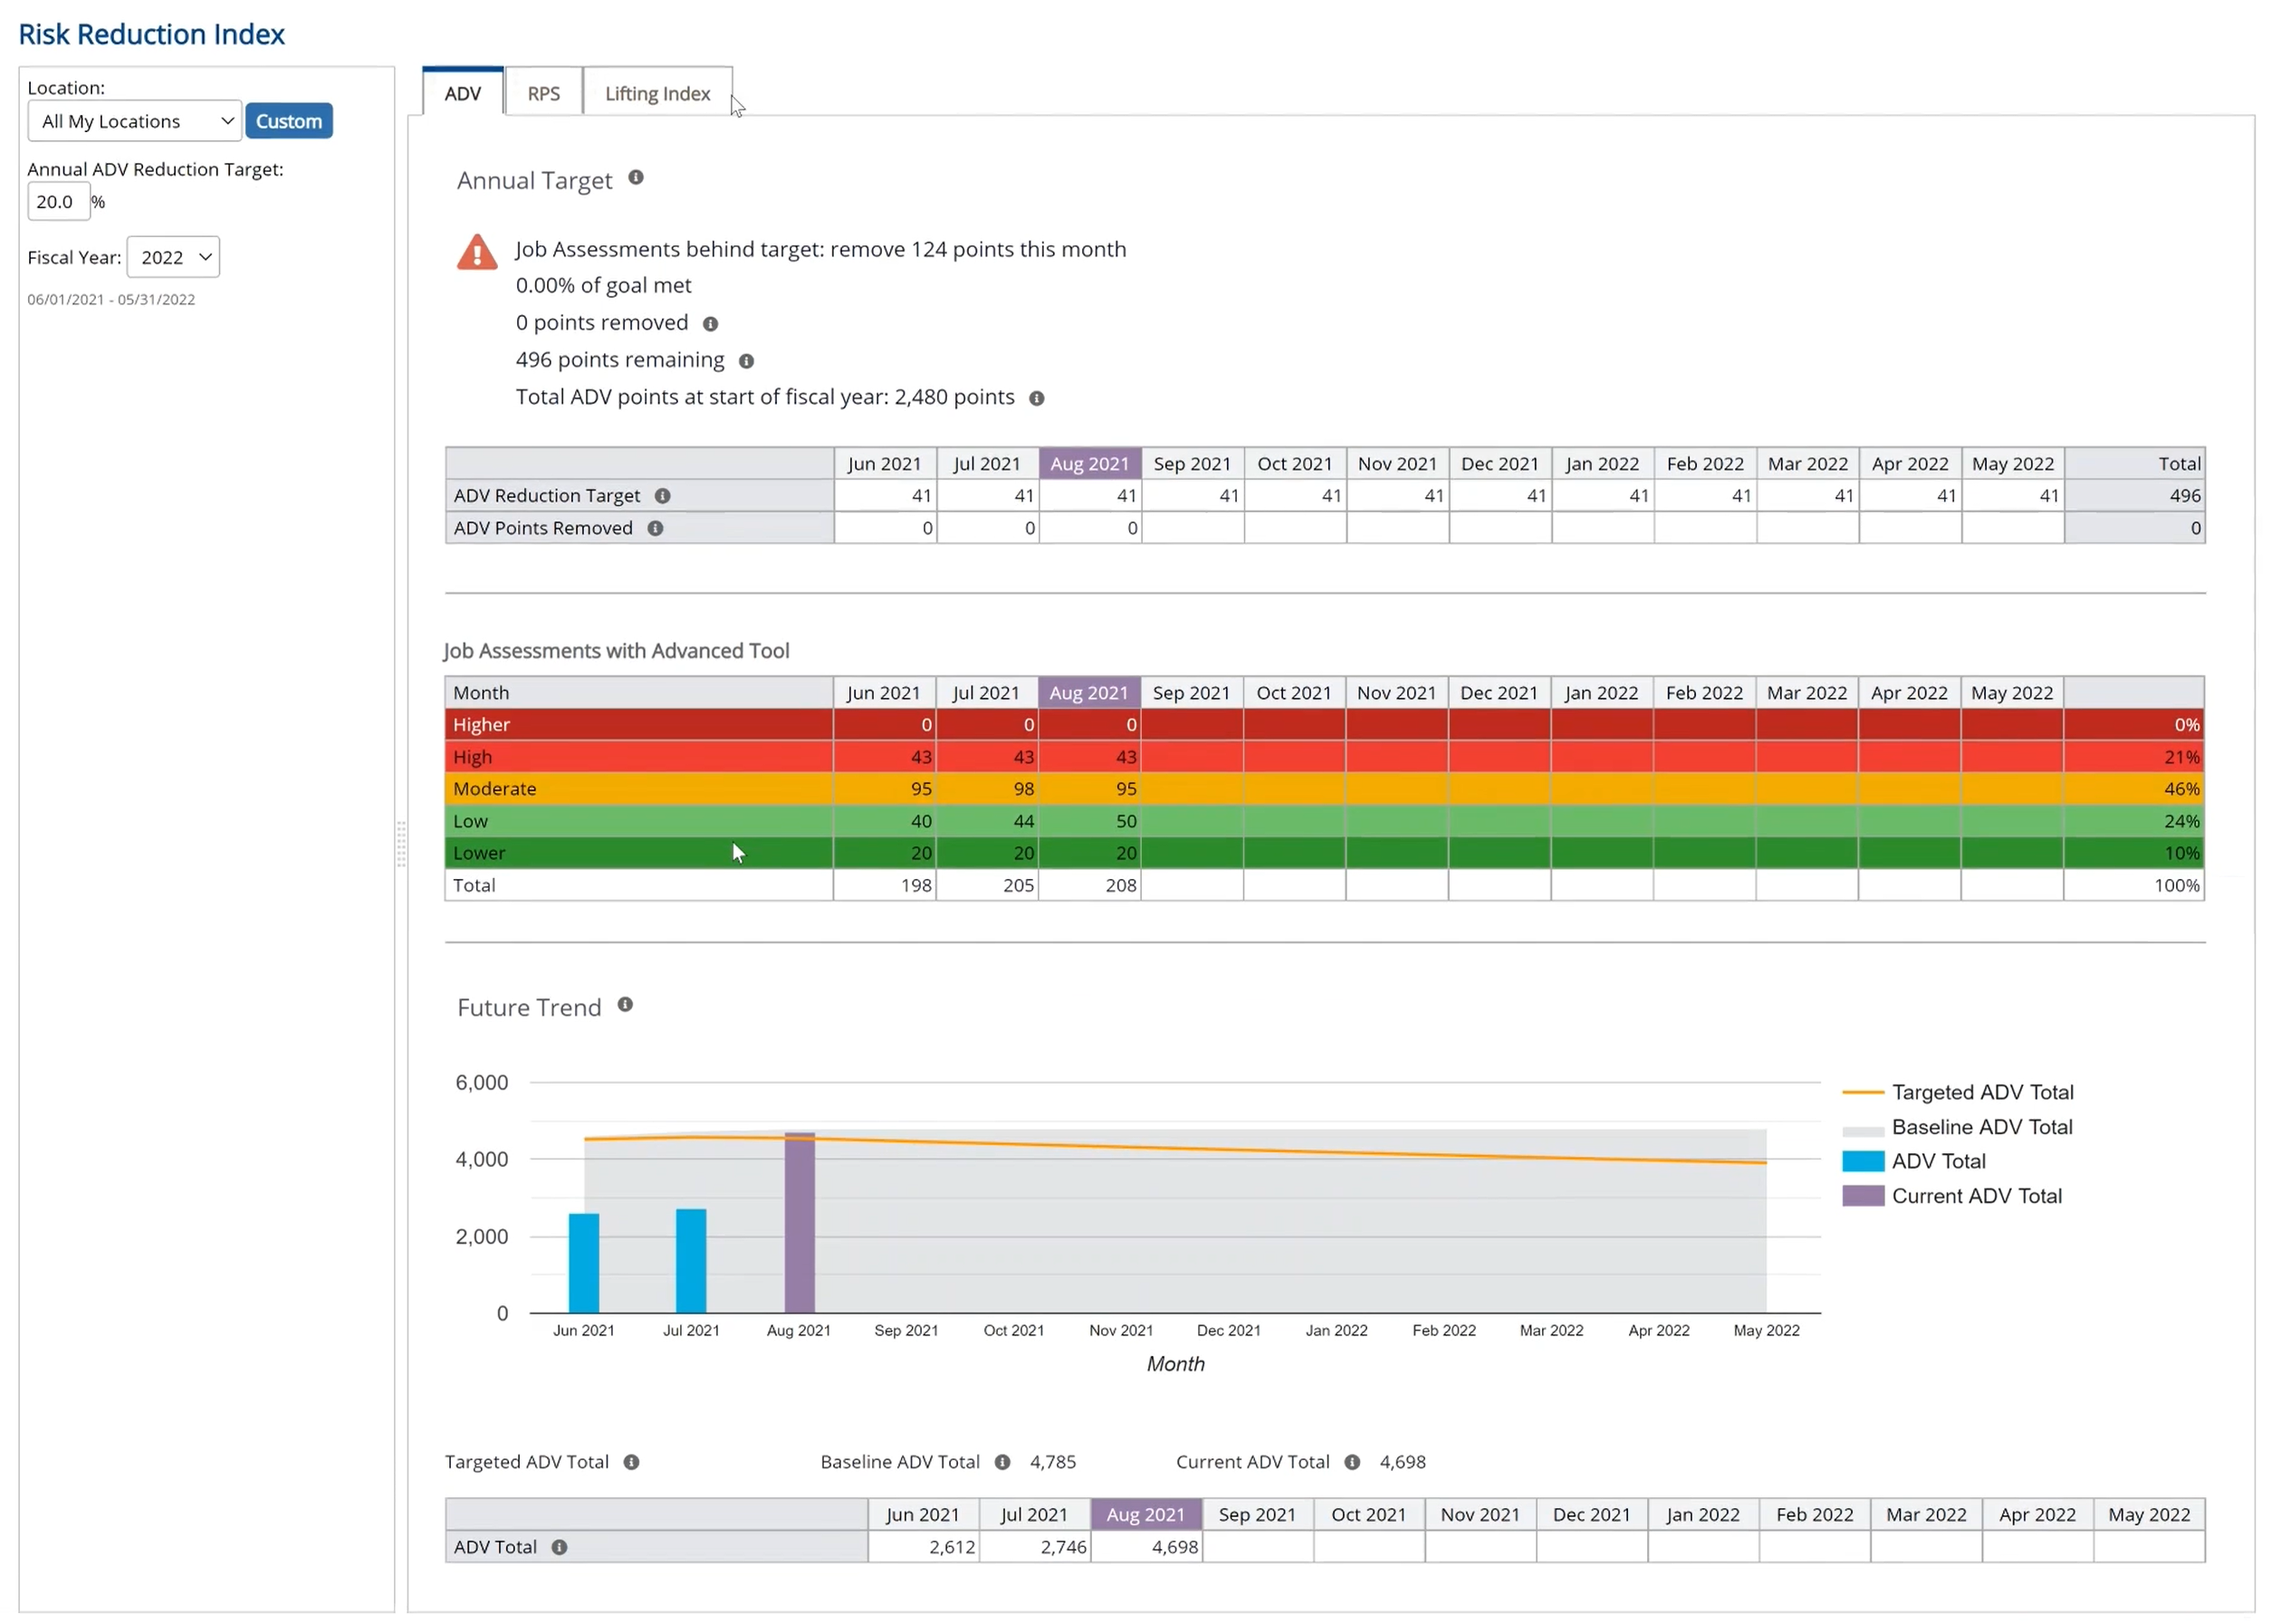
The Risk Reduction Index offers two approaches to tracking MSD risk reduction: an annual target and a future trend. The default annual reduction target is 20% but you can change this percentage at any time.
Note that risk reduction can only be calculated for job assessments that have both a baseline and a follow-up risk score.
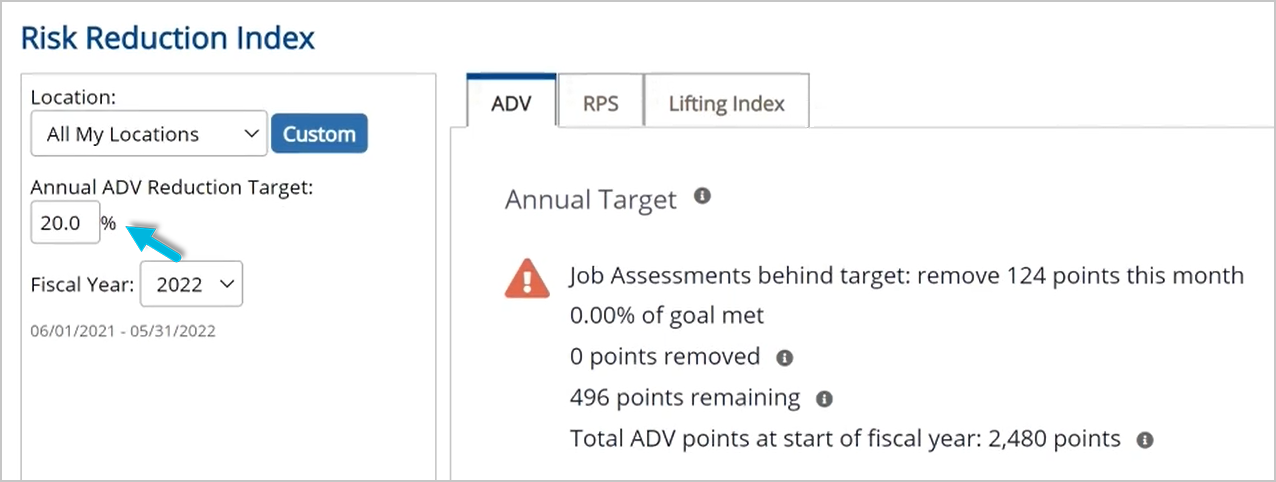
The Annual Target is a static model that shows where you are right now against a fixed point-reduction goal, based on Advanced Assessment scores (ADV), Risk Priority scores (RPS), and Lifting Index scores.
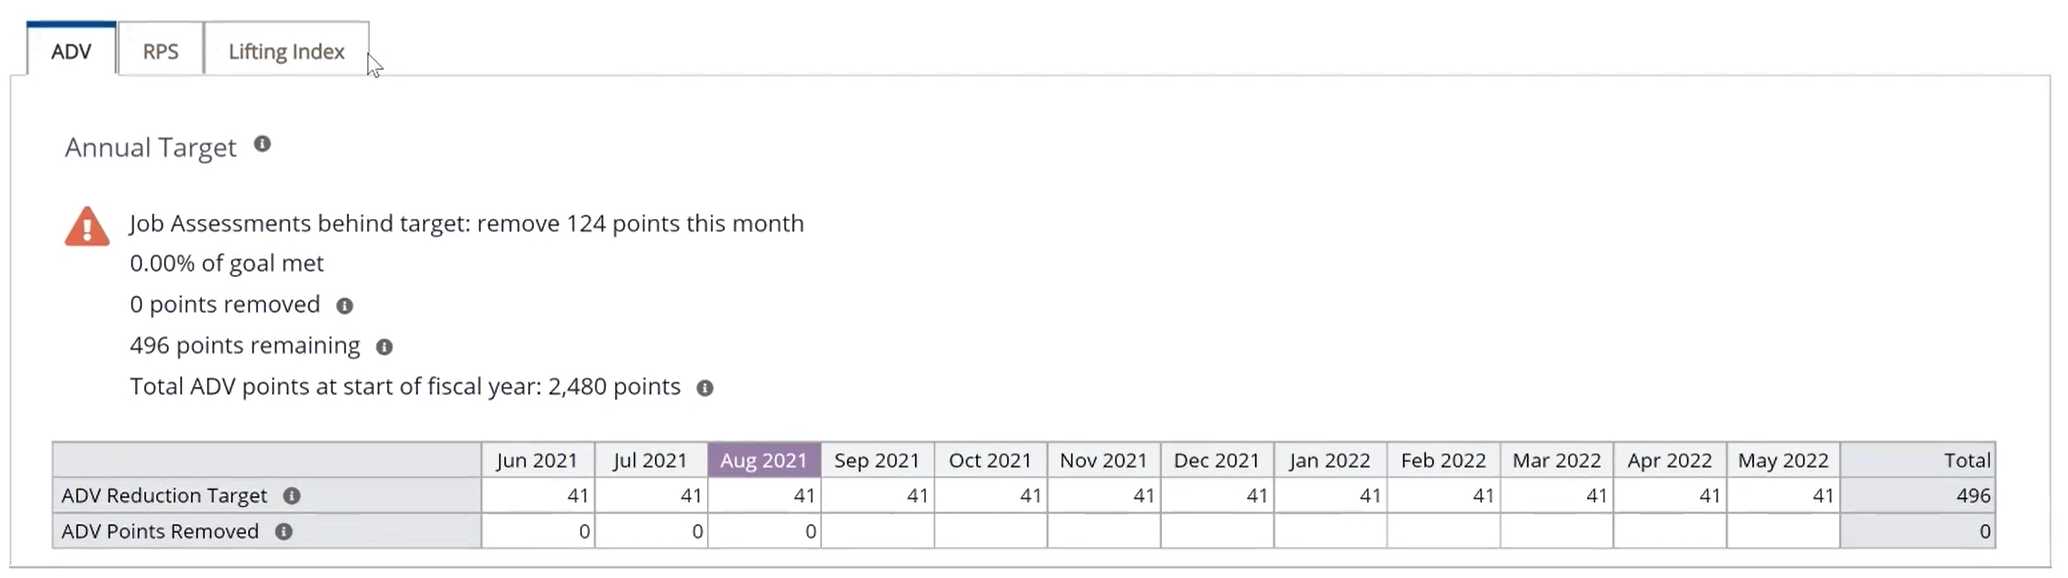
The annual (Advanced, RPS, or Lifting Index) reduction target is the total number of assessment score points you’re aiming to remove from job assessments in the current year. It is calculated at the start of the year based on the points available or the last point total. This number is multiplied by the annual reduction target percentage, which is distributed over the available months to provide a consistent monthly reduction target for sites to focus on. Remember that the goal is to reduce MSD risk throughout the year by implementing improvements that lower the assessment scores (that is, remove points). To stay ahead of target, remove points equal to or greater than the monthly reduction target. The number of points removed is totaled each month.
The Future Trend is a dynamic model that continuously adjusts the target and shows you where you are headed in the future. It accounts for any risk reduction efforts that you take on, and any new job assessments you add. The Targeted (Advanced or RPS) Total line, in orange, adjusts as new job assessments are added and scores are reduced for existing job assessments. The focus of the dynamic trend is less on the exact numbers and more on the interaction between the number of points removed and the number of job assessments added.
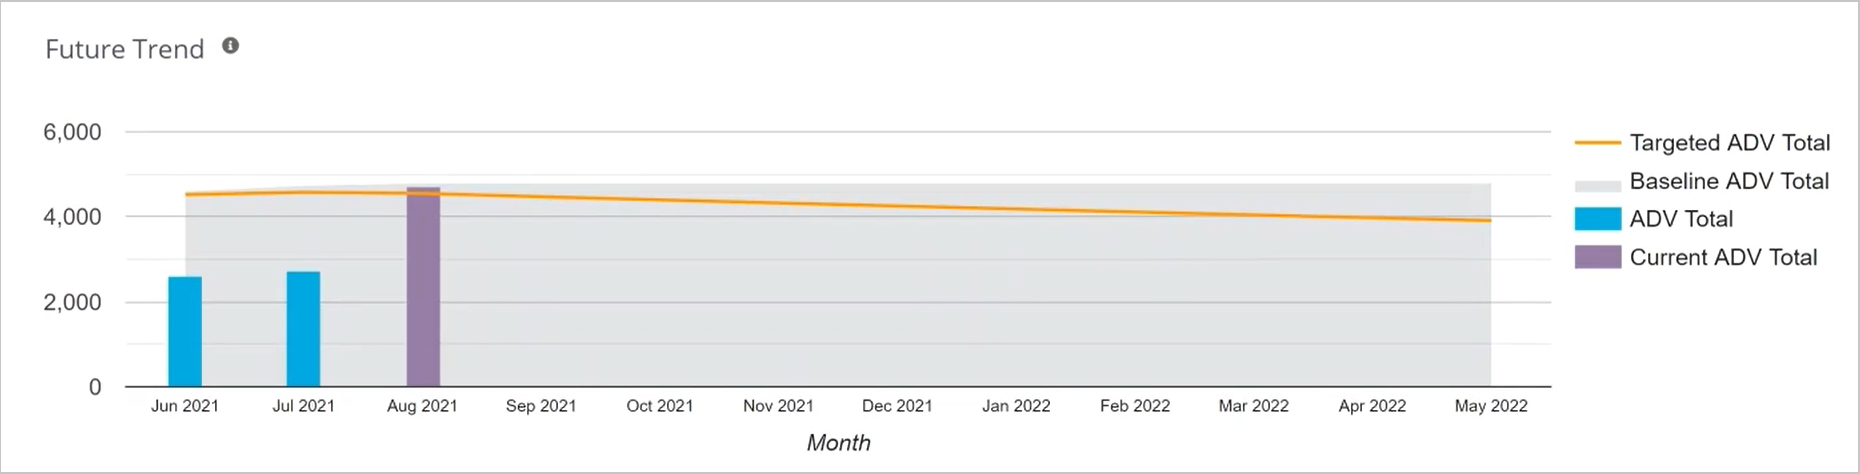
The blue and purple vertical bars represent the number of points in the system after improvements have been entered; you’re ahead of target when the vertical bars are below the Targeted Total line, and you’re behind target when the vertical bars are above the line. Keep in mind this is a leading measures report, so the goal is to reduce risk, or remove points. Even though the target line adjusts upward as job assessments are added, to remain ahead of target, you must reduce risk or eliminate points from the system.
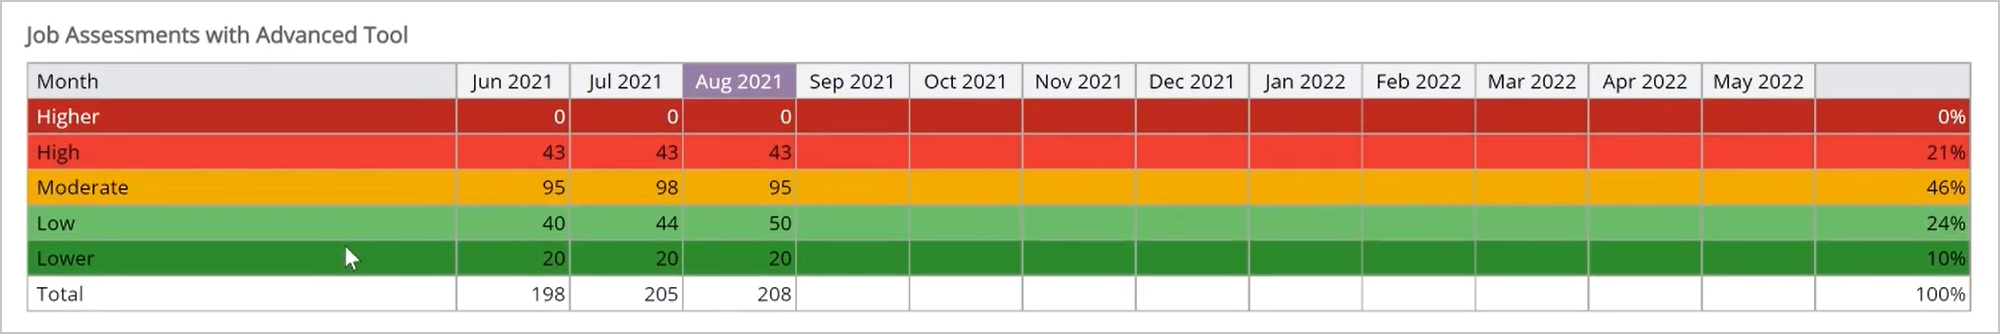
Workstations at Low/No Risk
In the color-coded Job Assessments table, the number of job assessments with Advanced, RPS, or Lifting Index scores is tallied each month for each risk level, providing a second key performance indicator: percent of workstations at low or no risk.