

Summary Reports
Download this list of metrics VelocityEHS recommends that you track as part of your ergonomics program, such as risk reduction percentages or number of assessments with identified direct causes.
Summary Reports compile data and information from various areas of job assessments so you can see it all in one place and determine if you’re staying on target and meeting business objectives concerning ergonomics. Most of the recommended metrics data is located in the Summary Reports. Additional metrics can be found in Metrics and Goals.
Job Assessment Summary
The Job Assessment Summary is an overall summary of all job assessment scores, including lift/lower/push/pull/carry scores. You can also see risk reduction percentages (number of assessments for which you’ve reduced risk and by what percent). To filter the data by a specific location, select Custom and then the location(s).
The pie charts provide aggregated data. The Job Assessment Status chart shows current statuses for all assessments.
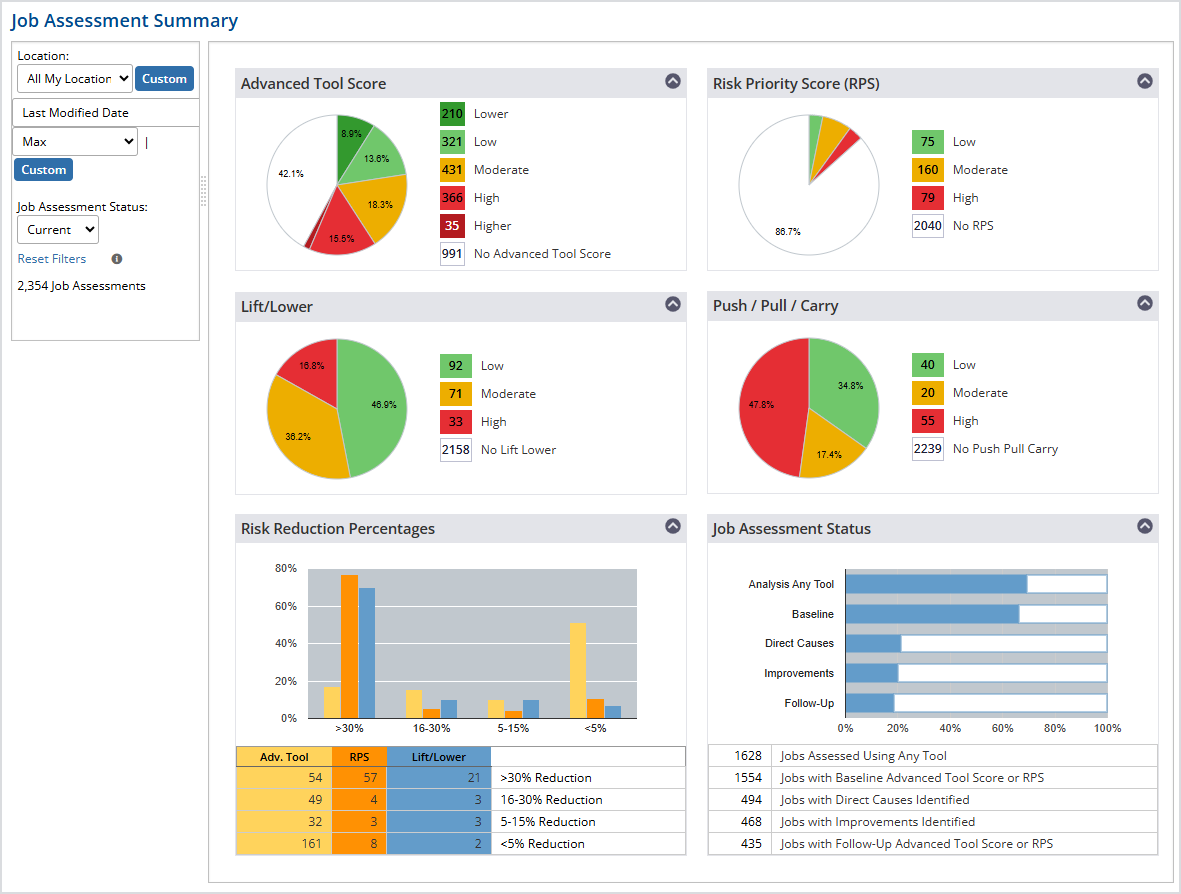
Select an area in a pie chart to display details for it in the grid on the lower half of the page.
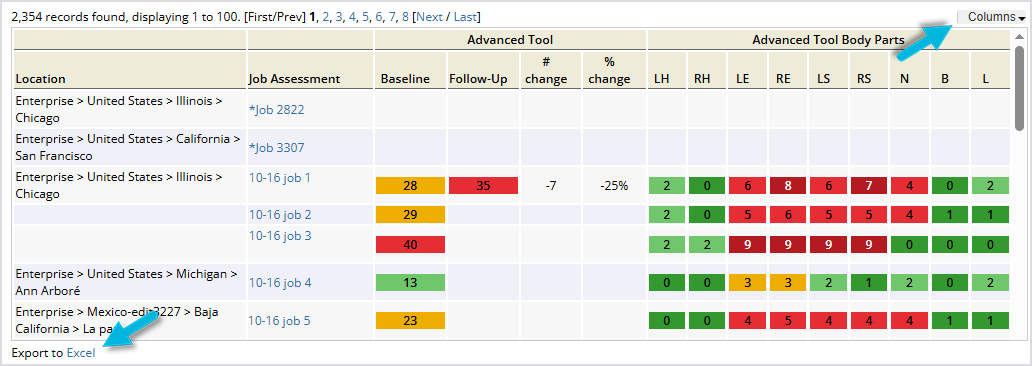
- Select a Job Assessment to view or edit it.
- Select Columns in the top-right corner of the grid to show or hide columns. Select a column heading to sort the results by a particular field.
- Select Excel at the bottom of the page to export the data to a Microsoft Excel file.
Note: The Whole-Body Assessment Totals columns (Low, Moderate, High) reflect totals from manual whole-body assessments only.
Improvement Plan Summary
The Improvement Plan Summary page displays all improvements for a specified location with options to sort by various attributes.
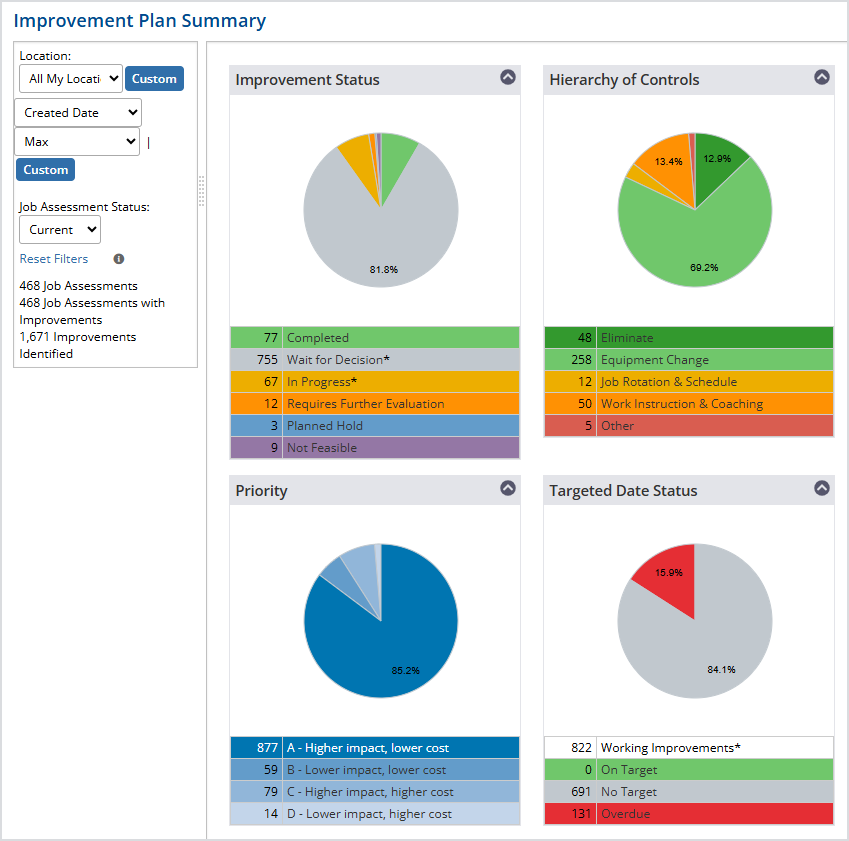
Select an area in a pie chart to display details for it in the grid.
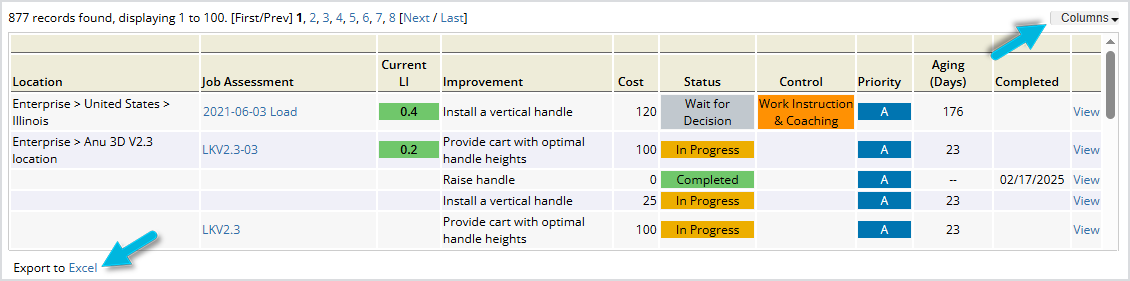
- Select a Job Assessment to view or edit it.
- Select View to view or edit a particular improvement.
- The Columns and Excel options are also available here.
Direct Cause Summary
The Direct Cause Summary provides a “big picture” of the direct causes most commonly affecting MSD risk for future planning and shows you where issues are originating (product design, workstation layout, etc.).
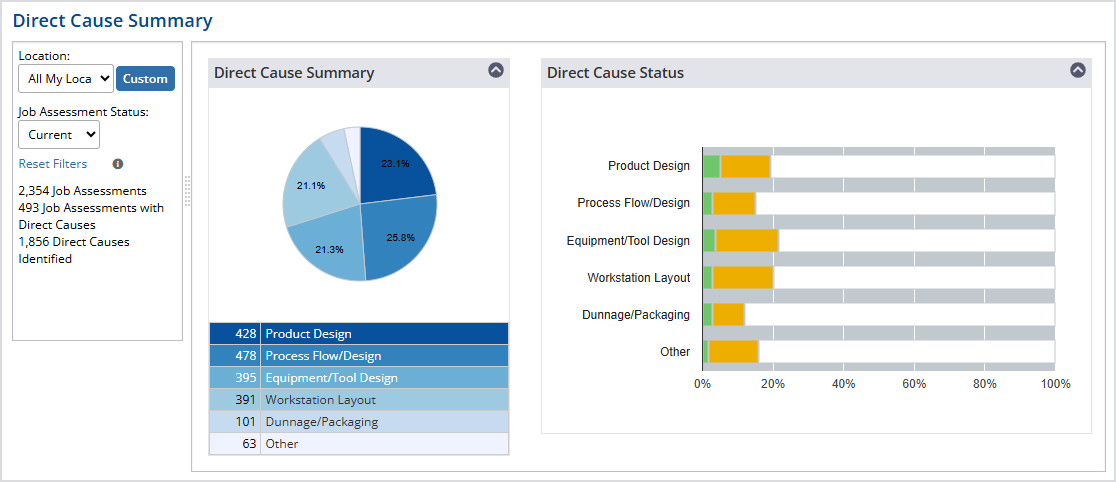
Select an area in a chart to view associated job assessments in the grid.
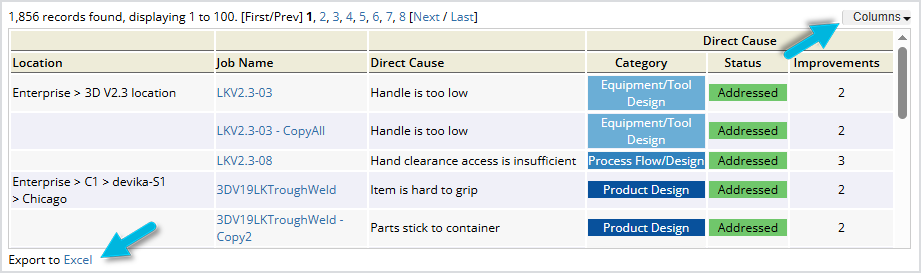
- Select a Job Name to view or edit the job assessment.
- The Columns and Excel options are also available here.
Return on Investment Summary
The Return on Investment Summary enables you to quickly see a list of job assessments that have ROI calculations entered for them in the Improvements phase.
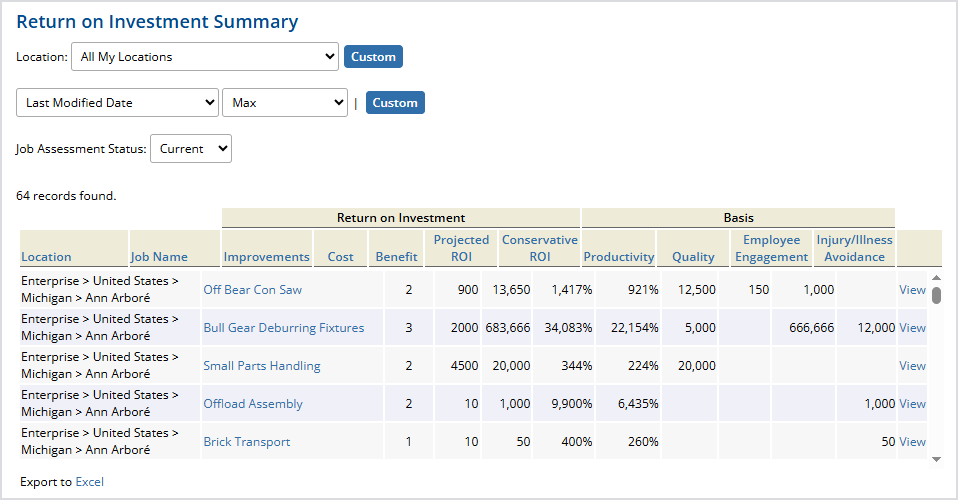
- Select a Job Name to view or edit the job assessment.
- Select View to go directly to the Improvements page for that assessment.
- Select a column heading to sort by a particular field.
- The Excel option is also available here.
