
Working with the Dashboard
The dashboard is the first thing you’ll see when you log into Operational Risk. The default dashboard is a “global” dashboard, visible to all, along with all other dashboards created by a system administrator. Other uses can create personal dashboards that only they can view.
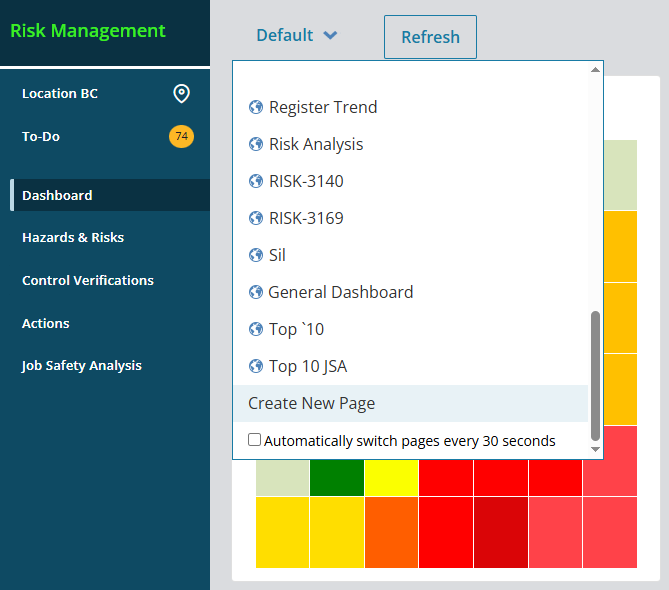
A dashboard is made up of “webparts,” or tables of different groups of data. From the drop-down menu, you can view other existing dashboards or set up a new dashboard to reflect only the data sets you need to see.
Create a new dashboard
To create a new dashboard, select the name of the current dashboard from the drop-down menu, and then select Create New Page.
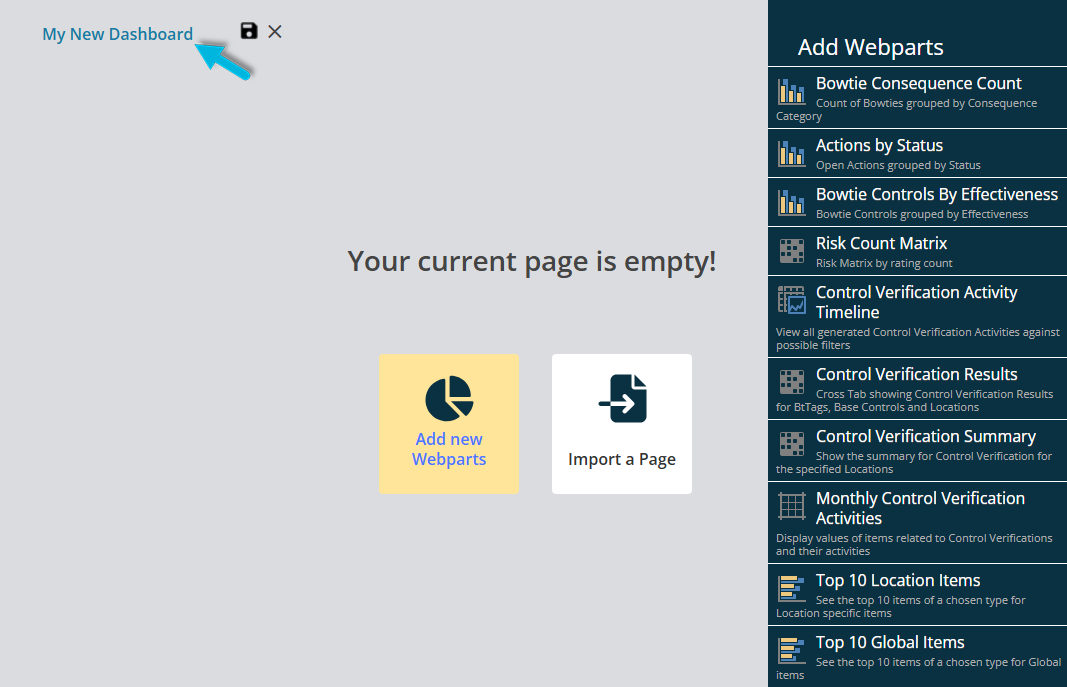
Give the new dashboard a name at the top left of the page. To begin adding webparts to the dashboard, select Add new Webparts, or hover over the arrow at the right side of the page, to display the list of available webparts. Select a webpart to add it to the dashboard.
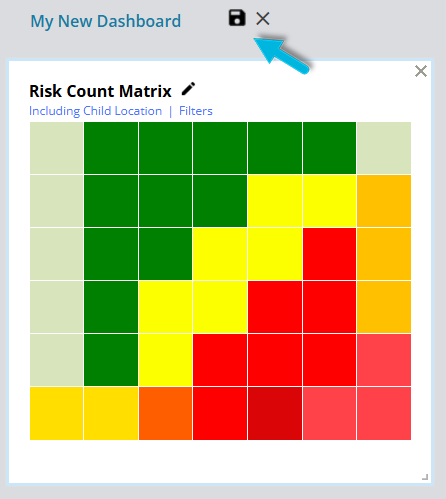
Click and drag a webpart border to change its size and position. When you’re finished building your dashboard, select the Save icon next to the dashboard name.
Create a dashboard from a template
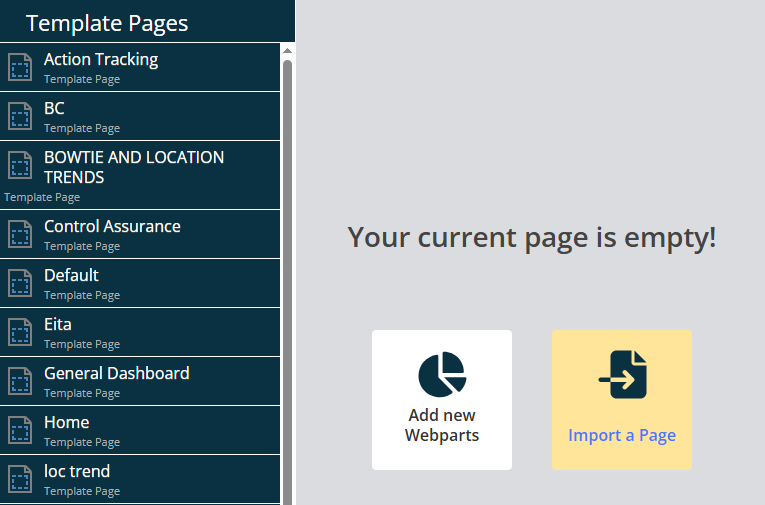
To import a dashboard “template” previously set up by a system administrator, with webparts already configured, select Import a Page and then choose the Template Page you want to use from the list. Make changes as necessary, name the dashboard, and then save it.
Edit a dashboard
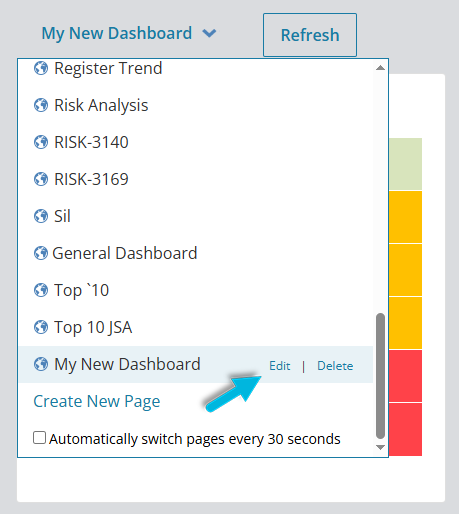
To edit an existing dashboard, select the dashboard in the drop-down menu, and then select Edit to switch to edit mode. Update the dashboard as necessary, and then Save your changes.
Additional options
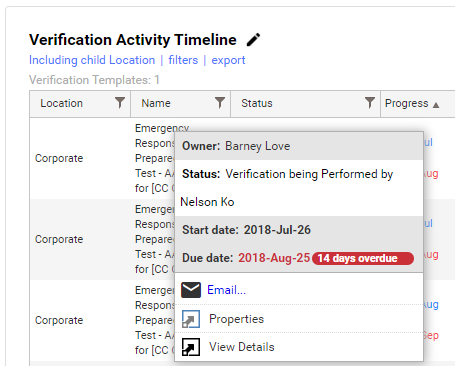
When viewing a dashboard, you have some additional options for most webparts:
- Edit a webpart name
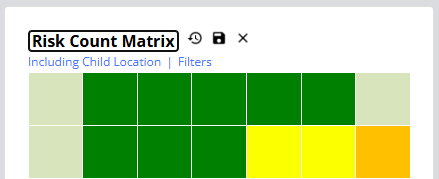
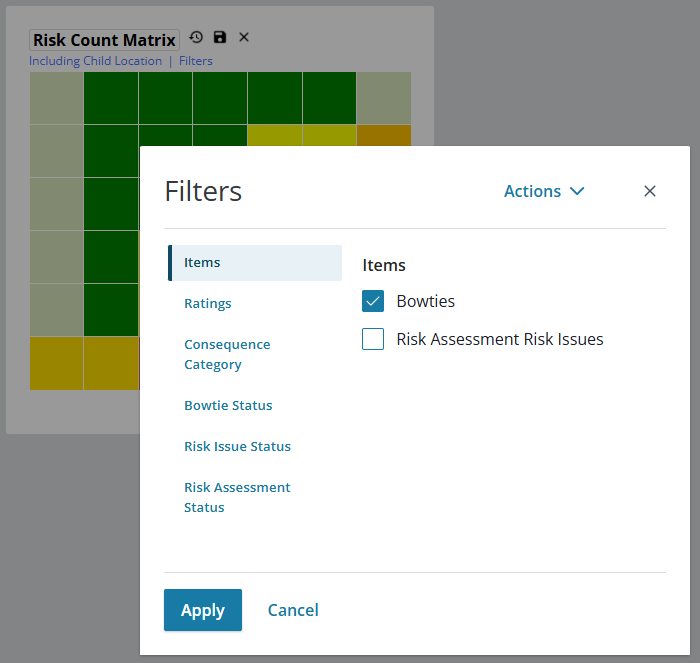
- Filter the data
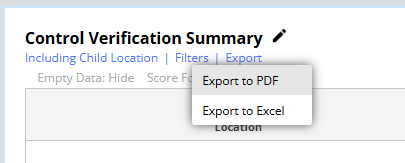
- Export the data to a PDF or Excel file
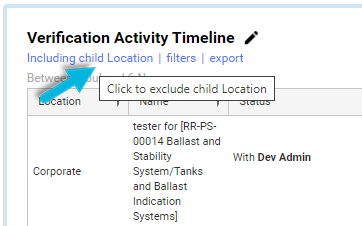
- Include or exclude data from sub-locations (“child” locations)
- Click into certain areas to drill down into the data for more detail