

Advanced Dashboard and Reports for Industrial Ergonomics
Accelerate Advanced Dashboards and Reports provide customizable, comparative analytics that turn static data into a strategic management resource. These tools enable you to analyze performance across sites and time periods, identify trends, and make proactive improvements in a user-friendly and visual interface. You can manipulate the data in an infinite number of ways. The dashboards and reports reflect data from all Accelerate solutions your organization has purchased.
For background information about Accelerate Dashboards and Reports, see Getting Started with Advanced Dashboards and Reports.
This article describes the Advanced Dashboard and Reports available for Industrial Ergonomics on Accelerate.
Industrial Ergonomics Advanced Dashboard
If your organization has been using Industrial Ergonomics long enough to accumulate a meaningful amount of data across locations, the Advanced Dashboard options provide a comprehensive view of ergonomics-related trends and key performance indicators. They consolidate your Industrial Ergonomics data so you can organize, explore, and share insights from one place.
The Industrial Ergonomics Advanced Dashboard helps you communicate program progress to leadership and maintain organizational support. Safety leaders can use the dashboard’s data sets to monitor site-level performance and summarize results for business stakeholders.
The Advanced Dashboard is available to all users.
Benefits of the Advanced Dashboard
While you can continue to track performance in the existing Industrial Ergonomics dashboard and related reports, the Advanced Dashboard merges and enhances this information for better usability, providing some key benefits:
- Consolidates information across solutions
- Provides greater control and customization of displayed content
- Includes enhanced graphs and charts for easier visualization
- Provides option to export dashboard data via direct download, or to distribute data via email, once or according to a recurring schedule
Default Data Sets
The Industrial Ergonomics Advanced Dashboard includes nine default data sets designed to support site-to-site comparisons. You can view and compare data by month, quarter, or year. You may modify these data sets and also create your own; you’re not limited to the defaults.
Default data sets include:
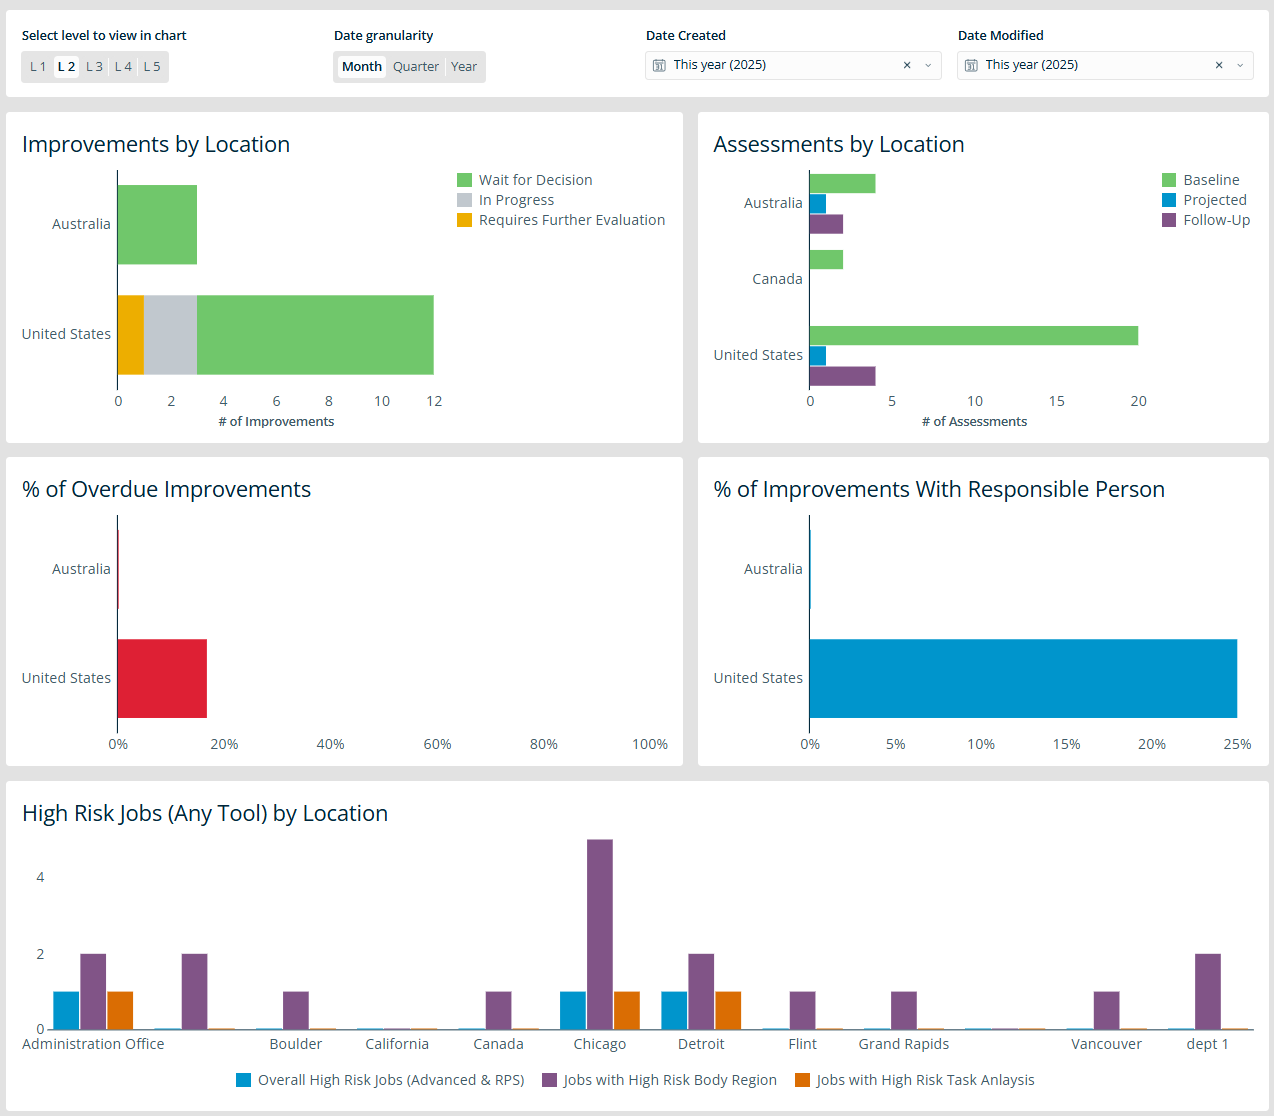
- Assessments by Location – monitor assessment activities by site
- Baseline Assessments Created by Location – review and compare baseline assessments created for each location
- High-Risk Jobs (Any Tool) by Location – highlight high-risk jobs by site, regardless of assessment tool used. This includes a combined Advanced and Manual Whole-Body Assessment count, jobs with at least one high-risk body region, and jobs with at least one high-risk Manual Material Handling Analysis.
- Direct Causes Created by Location – track and compare direct causes in assessments by site
- Improvements by Location – view and analyze improvements across different sites
- % of Overdue Improvements – track the percentage of improvements that are overdue
- % of Improvements with Responsible Person – identify improvements that have an assigned responsible person
- Engineering Improvements Created – monitor improvements that fall into the Hierarchy of Controls Engineering category
- Administrative Improvements Created – monitor improvements that fall into the Hierarchy of Controls Administrative category
Here’s how some of these data sets may appear on your dashboard:
For more about navigating and customizing an Advanced dashboard, see Advanced Dashboard.
Industrial Ergonomics Advanced Reports
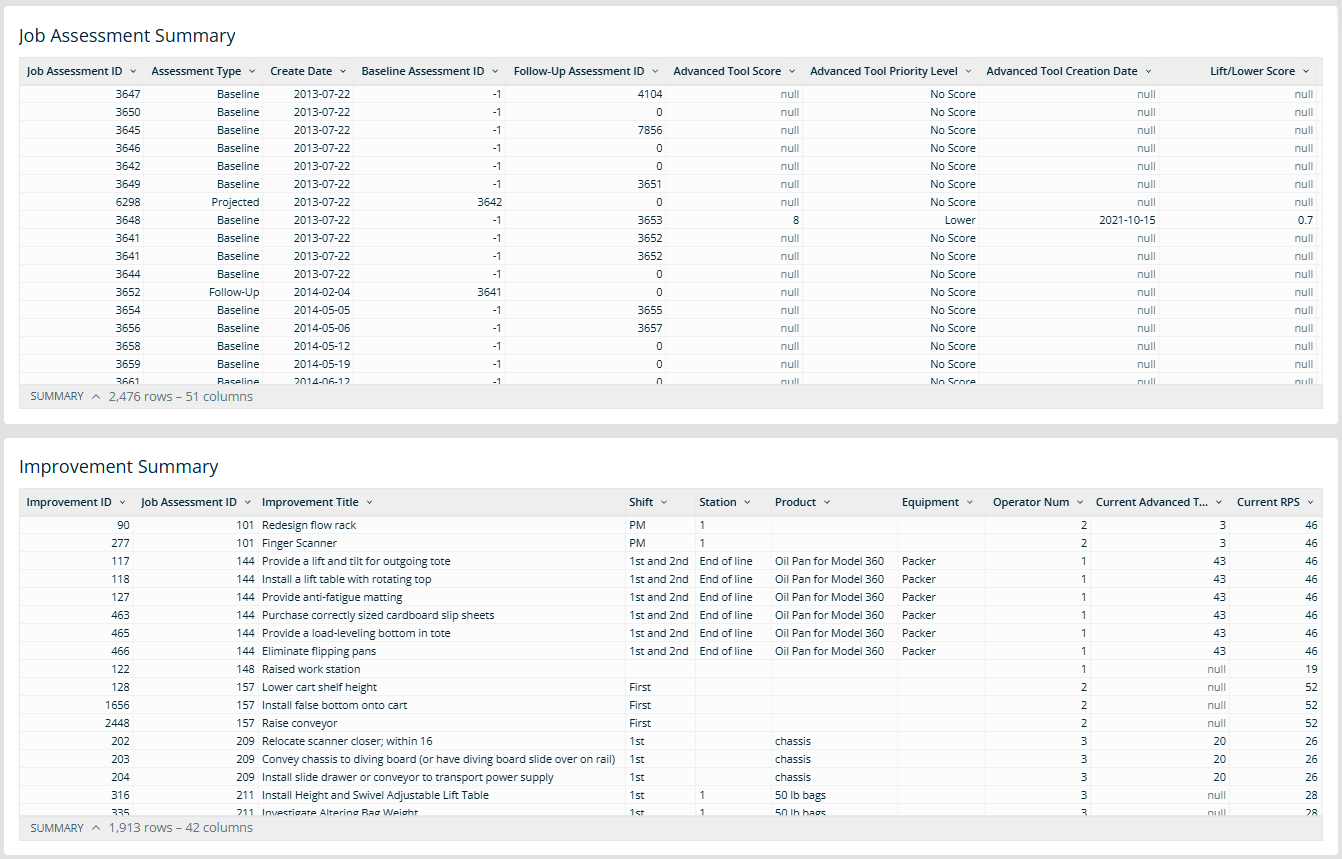
While the Advanced Dashboard offers high-level visibility and engagement for everyone, the Industrial Ergonomics Advanced Reports are useful for deeper analysis and targeted decision-making for administrators. These include two default tables that provide much of the same data—in interactive table format—as is currently available in the Industrial Ergonomics Summary Reports, with additional options to view, filter, sort, format, and save the data, and to export the data, once or according to a recurring schedule.
- Job Assessment Summary – a comprehensive view of job assessments
- Improvement Summary – a summary of all improvements and their statuses
For more about navigating and customizing advanced reports, see Advanced Reports.
How to Access Industrial Ergonomics Advanced Dashboards and Reports
- Go to Platform > Advanced Dashboard (or Advanced Reports).
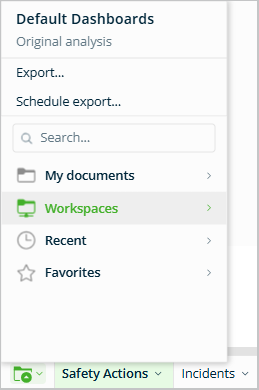
- Expand the folder icon at the bottom left of the page and select Workspaces.
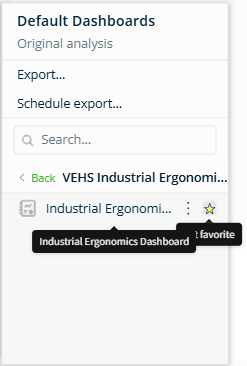
- Find VEHS Industrial Ergonomics Dashboards (or VEHS Industrial Ergonomics Reports) and click on it.
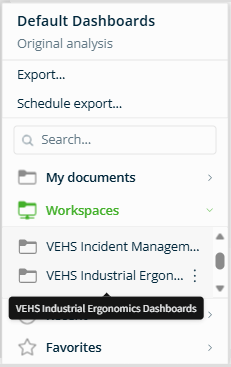
- Hover over it and select the star icon to save it to your Favorites list for easy future access. Then click on the dashboard (or report) to open it.
FAQs
- Can I set the Industrial Ergonomics Dashboard or Reports as my default page? No. However, you can set them as “favorites” (see above), or choose Save as at the bottom right of the page so that it appears under My Documents for quicker future access.
- Why is my dashboard not displaying any data? There may be no records within the selected date range. Adjust the range using the filter options and refresh the page.
