
Risk Verification on the Dashboard
There are four dashboard “webparts” you can use to extract information about completed verification activities.
Control Verification Activity Timeline
Use the Control Verification Activity Timeline to monitor scheduled verification activities for a location or locations in a chart format, including the activity name, status, and progress. The data in this table is updated in real time as verification activities progress.
- Select an activity in the table to view more detail.
- Select filters at the top of the table to filter the data by control verification template, control verifications, performance standard type, and verification date range.
- Select export to export the data to a PDF file.

Control Verification Results
The Control Verification Results table uses color-coding to provide a snapshot, by location and base control, of how effective the current controls actually are, based on completed verification activity results. You can see areas that need improvement at a glance. The data in this table is updated in real time.
- A white tab displays if no verification is available to report on, and a colored tab displays if verification is complete. Select a colored tab to view more detail about the verification results.
- Select filters at the top of the table to filter the data by location, base control, data source (latest or average), and view type (summary or detail).
- Select export to export the data to a PDF or Excel file.

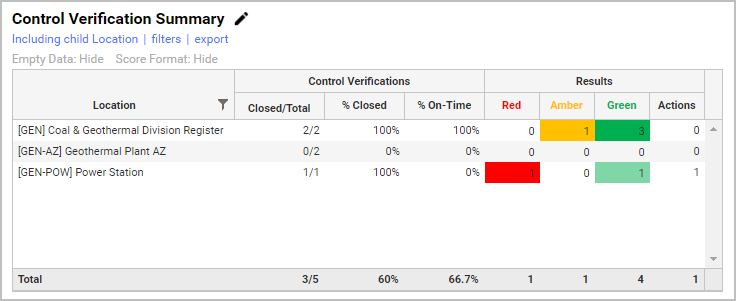
Control Verification Summary
The Control Verification Summary table summarizes verification results by location. The data is updated in real time.
- The Verifications section shows verification progress for the locations listed. Select a row to view more detail about the verification.
- The Results section shows the number and score category (define during system setup in Administration > Editor > Lookups) for verification results at the location.
- Select filters at the top of the table to filter the data by performance standard type and verification date range.
- Select export to export the data to a PDF or Excel file.
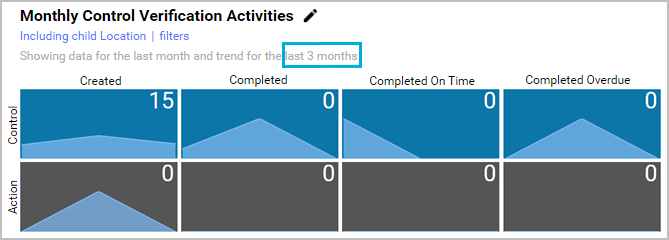
Monthly Control Verification Activities
The Monthly Control Verification Activities table shows the number of verification activities and/or actions created and completed for the last month, for the current location, and the trends for a selected timeframe. The data in this table is updated nightly.
- Select a cell to view more detail about the verification or action.
- Select filters at the top of the table to change the number of months (up to 24) that the trend lines should include. In this example, the trend lines in the cells represent the past 3 months.